

Question: Type or paste question here Question 1 Financial Statement modeling is a very important tool used by managers to forecast the future financial performance and
 Type or paste question here
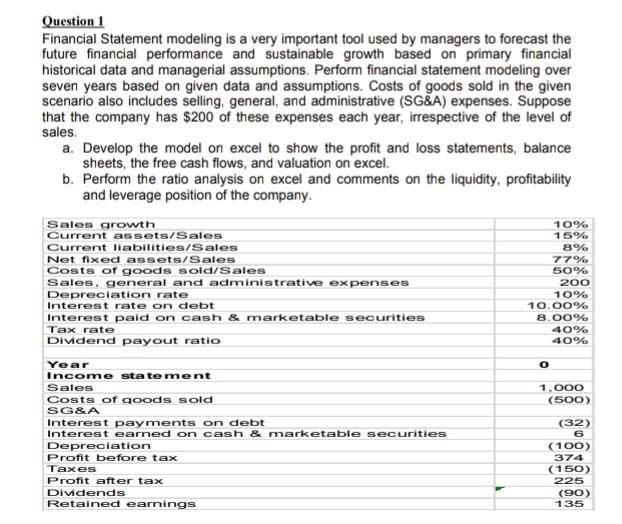
Question 1 Financial Statement modeling is a very important tool used by managers to forecast the future financial performance and sustainable growth based on primary financial historical data and managerial assumptions. Perform financial statement modeling over seven years based on given data and assumptions. Costs of goods sold in the given scenario also includes selling, general, and administrative (SG&A) expenses. Suppose that the company has $200 of these expenses each year, irrespective of the level of sales a. Develop the model on excel to show the profit and loss statements, balance sheets, the free cash flows, and valuation on excel. b. Perform the ratio analysis on excel and comments on the liquidity, profitability and leverage position of the company. Sales growth Current assets/Sales Current liabilities/Sales Net fixed assets/Sales Costs of goods sold/Sales Sales, general and administrative expenses Depreciation rate Interest rate on debt Interest paid on cash & marketable securities Tax rate 10% 15% 8% 77% 50% 200 10% 10.00% 8.00% 40% 40% Dividend payout ratio o Year Income statement Sales 1.000 (500) Costs of goods sold SG&A Interest payments on debt Interest earned on cash & marketable securities Depreciation Profit before tax Taxes Profit after tax Dividends Retained earnings (32) 6 (100) 374 (150) 225 (90) 135 Question 1 Financial Statement modeling is a very important tool used by managers to forecast the future financial performance and sustainable growth based on primary financial historical data and managerial assumptions. Perform financial statement modeling over seven years based on given data and assumptions. Costs of goods sold in the given scenario also includes selling, general, and administrative (SG&A) expenses. Suppose that the company has $200 of these expenses each year, irrespective of the level of sales a. Develop the model on excel to show the profit and loss statements, balance sheets, the free cash flows, and valuation on excel. b. Perform the ratio analysis on excel and comments on the liquidity, profitability and leverage position of the company. Sales growth Current assets/Sales Current liabilities/Sales Net fixed assets/Sales Costs of goods sold/Sales Sales, general and administrative expenses Depreciation rate Interest rate on debt Interest paid on cash & marketable securities Tax rate 10% 15% 8% 77% 50% 200 10% 10.00% 8.00% 40% 40% Dividend payout ratio o Year Income statement Sales 1.000 (500) Costs of goods sold SG&A Interest payments on debt Interest earned on cash & marketable securities Depreciation Profit before tax Taxes Profit after tax Dividends Retained earnings (32) 6 (100) 374 (150) 225 (90) 135
Step by Step Solution
There are 3 Steps involved in it

Get step-by-step solutions from verified subject matter experts