

Question: Type or paste question here Required: Complete the purple cells for horizontal and vertical analysis for Tootsie Roll Industries using the following formulas: Vertical Analysis:
Type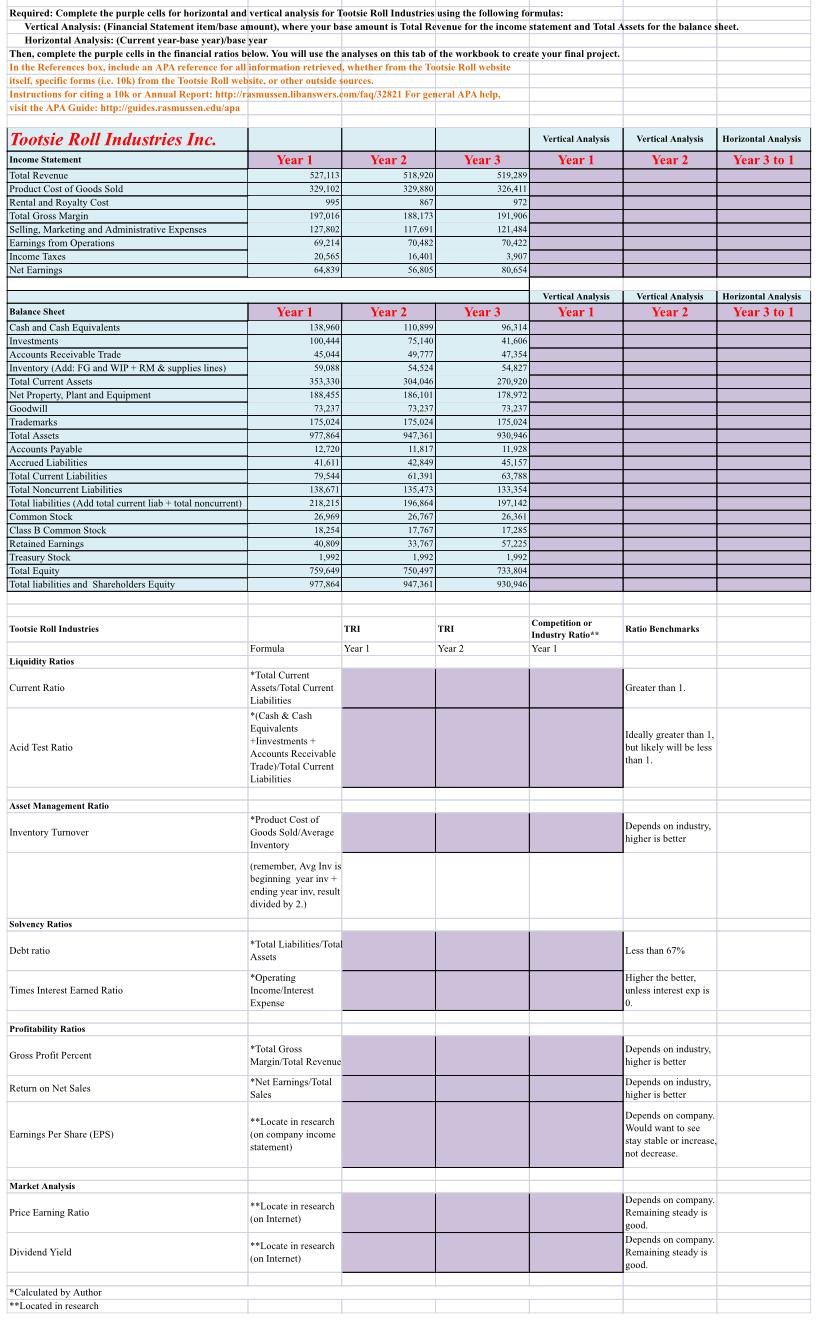 or paste question here
Required: Complete the purple cells for horizontal and vertical analysis for Tootsie Roll Industries using the following formulas: Vertical Analysis: (Financial Statement item/base amount), where your base amount is Total Revenue for the income statement and Total Assets for the balance sheet. Horizontal Analysis: (Current year-base year)base year Then, complete the purple cells in the financial ratios below. You will use the analyses on this tab of the workbook to create your final project. In the References box, include an APA reference for all information retrieved, whether from the Tootsie Roll website itself, specific forms (i.e. 10k) from the Tootsie Roll website, or other outside sources. Instructions for citing a 10k or Annual Report: http://rasmussen.libanswers.com/faq/32821 For general APA help, visit the APA Guide: http://guides.rasmussen.edu/apa Vertical Analysis Vertical Analysis Horizontal Analysis Year 1 Year 2 Year 3 to 1 Tootsie Roll Industries Inc. Income Statement Total Revenue Product Cost of Goods Sold Rental and Royalty Cost Total Gross Margin Selling, Marketing and Administrative Expenses Earnings from Operations Income Taxes Net Earnings Year 1 527,113 329,102 995 197,016 127.802 69.214 20,565 64.839 Year 2 518,920 329,880 867 188,173 117,691 70,482 16,401 S6,805 Year 3 519.289 326,411 972 191,906 121,484 70,422 3.907 80.654 Vertical Analysis Year 1 Vertical Analysis Year 2 Horizontal Analysis Year 3 to 1 Balance Sheet Cash and Cash Equivalents Investments Accounts Receivable Trade Inventory (Add: FG and WIP+RM & supplies lines) Total Current Assets Net Property. Plant and Equipment Goodwill Trademarks Total Assets Accounts Payable Accrued Liabilities Total Current Liabilities Total Noncurrent Liabilities Total liabilities (Add total current liab+ total noncurrent) Common Stock Class B Common Stock Retained Earnings Treasury Stock Total Equity Total liabilities and Shareholders Equity Year 1 138,960 100.444 45,044 59,08 353,330 188,455 73.2371 175,024 977,864 12,720 41.611 79,544 138,671 218.2151 26,969 18,254 40,809 1.992 759,649 977,864 Year 2 110,899 75,140 49,777 54,524 304,046 186,101 73.237 175,024 947,361 11,817 42,849 61,391 135.473 196,864 26,767 17,767 33,7671 1,992 750.497 947.361 Year 3 96,314 41.6616 47,354 54,827 270,920 178,972 73.237 175,024 930.946 11,928 45.157 63,788 133,354 197,142 26,361 17,285 37.225 1,992 733,804 9.30,946 Tootsie Roll Industries TRI TRI Ratio Benchmarks Competition or Industry Ratio Year 1 Formula Year! Year 2 Liquidity Ratias Current Ratio Greater than 1. * Total Current Assets/Total Current Liabilities *(Cash & Cash Equivalents +Tinvestments + Accounts Receivable Trade Total Current Liabilities Acid Test Ratio Ideally greater than I. but likely will be less than 1 Asset Management Ratio Inventory Turnover Depends on industry, higher is better *Product Cost of Goods Sold Average Inventory (remember, Avg Invis beginning year in + ending year inv.result divided by 2.) Solvency Ratios Debt ratio *Total Liabilities/Total Assets Less than 67% Times Interest Eamed Ratio *Operating Income interest Expense Higher the better unless interest exp is 0. Profitability Ratios Gross Profit Percent *Total Gross Margin/Total Revenue * *Net Earnings/Total Sales Depends on industry, higher is better Depends on industry, higher is better Return on Net Sales Earnings Per Share (EPS) **Locate in research (on company income statement) Depends on company. Would want to see stay stable or increase, not decrease. Market Analysis Price Earning Ratio **Locate in research on Internet) Depends on company Remaining steady is good Depends on company Remaining steady is good Dividend Yield **Locate in research (on Internet) *Calculated by Author -Located in research Required: Complete the purple cells for horizontal and vertical analysis for Tootsie Roll Industries using the following formulas: Vertical Analysis: (Financial Statement item/base amount), where your base amount is Total Revenue for the income statement and Total Assets for the balance sheet. Horizontal Analysis: (Current year-base year)base year Then, complete the purple cells in the financial ratios below. You will use the analyses on this tab of the workbook to create your final project. In the References box, include an APA reference for all information retrieved, whether from the Tootsie Roll website itself, specific forms (i.e. 10k) from the Tootsie Roll website, or other outside sources. Instructions for citing a 10k or Annual Report: http://rasmussen.libanswers.com/faq/32821 For general APA help, visit the APA Guide: http://guides.rasmussen.edu/apa Vertical Analysis Vertical Analysis Horizontal Analysis Year 1 Year 2 Year 3 to 1 Tootsie Roll Industries Inc. Income Statement Total Revenue Product Cost of Goods Sold Rental and Royalty Cost Total Gross Margin Selling, Marketing and Administrative Expenses Earnings from Operations Income Taxes Net Earnings Year 1 527,113 329,102 995 197,016 127.802 69.214 20,565 64.839 Year 2 518,920 329,880 867 188,173 117,691 70,482 16,401 S6,805 Year 3 519.289 326,411 972 191,906 121,484 70,422 3.907 80.654 Vertical Analysis Year 1 Vertical Analysis Year 2 Horizontal Analysis Year 3 to 1 Balance Sheet Cash and Cash Equivalents Investments Accounts Receivable Trade Inventory (Add: FG and WIP+RM & supplies lines) Total Current Assets Net Property. Plant and Equipment Goodwill Trademarks Total Assets Accounts Payable Accrued Liabilities Total Current Liabilities Total Noncurrent Liabilities Total liabilities (Add total current liab+ total noncurrent) Common Stock Class B Common Stock Retained Earnings Treasury Stock Total Equity Total liabilities and Shareholders Equity Year 1 138,960 100.444 45,044 59,08 353,330 188,455 73.2371 175,024 977,864 12,720 41.611 79,544 138,671 218.2151 26,969 18,254 40,809 1.992 759,649 977,864 Year 2 110,899 75,140 49,777 54,524 304,046 186,101 73.237 175,024 947,361 11,817 42,849 61,391 135.473 196,864 26,767 17,767 33,7671 1,992 750.497 947.361 Year 3 96,314 41.6616 47,354 54,827 270,920 178,972 73.237 175,024 930.946 11,928 45.157 63,788 133,354 197,142 26,361 17,285 37.225 1,992 733,804 9.30,946 Tootsie Roll Industries TRI TRI Ratio Benchmarks Competition or Industry Ratio Year 1 Formula Year! Year 2 Liquidity Ratias Current Ratio Greater than 1. * Total Current Assets/Total Current Liabilities *(Cash & Cash Equivalents +Tinvestments + Accounts Receivable Trade Total Current Liabilities Acid Test Ratio Ideally greater than I. but likely will be less than 1 Asset Management Ratio Inventory Turnover Depends on industry, higher is better *Product Cost of Goods Sold Average Inventory (remember, Avg Invis beginning year in + ending year inv.result divided by 2.) Solvency Ratios Debt ratio *Total Liabilities/Total Assets Less than 67% Times Interest Eamed Ratio *Operating Income interest Expense Higher the better unless interest exp is 0. Profitability Ratios Gross Profit Percent *Total Gross Margin/Total Revenue * *Net Earnings/Total Sales Depends on industry, higher is better Depends on industry, higher is better Return on Net Sales Earnings Per Share (EPS) **Locate in research (on company income statement) Depends on company. Would want to see stay stable or increase, not decrease. Market Analysis Price Earning Ratio **Locate in research on Internet) Depends on company Remaining steady is good Depends on company Remaining steady is good Dividend Yield **Locate in research (on Internet) *Calculated by Author -Located in research
Step by Step Solution
There are 3 Steps involved in it

Get step-by-step solutions from verified subject matter experts