

Question: Type or paste question here What is the Barry for EV/EBITDA? How do to calculate it? 4-23 RATIO ANALYSIS Data for Barry Computer Co. and
Type or paste question here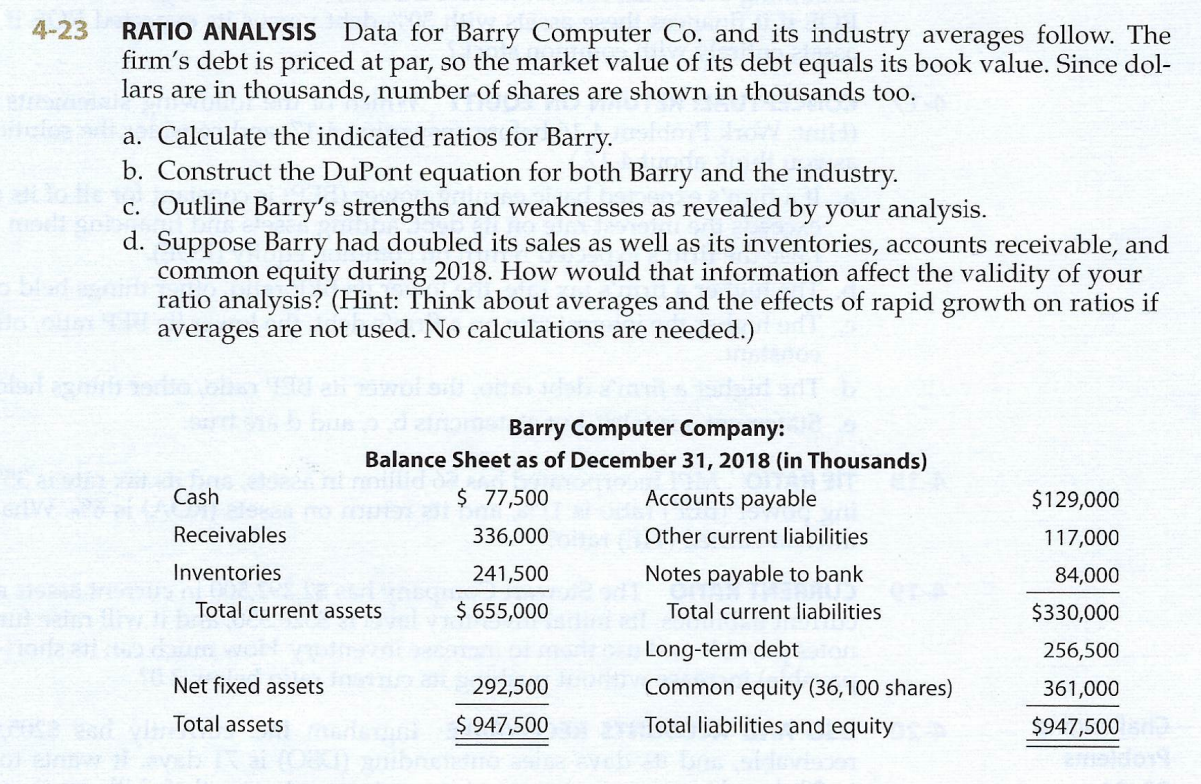
What is the Barry for EV/EBITDA? How do to calculate it?
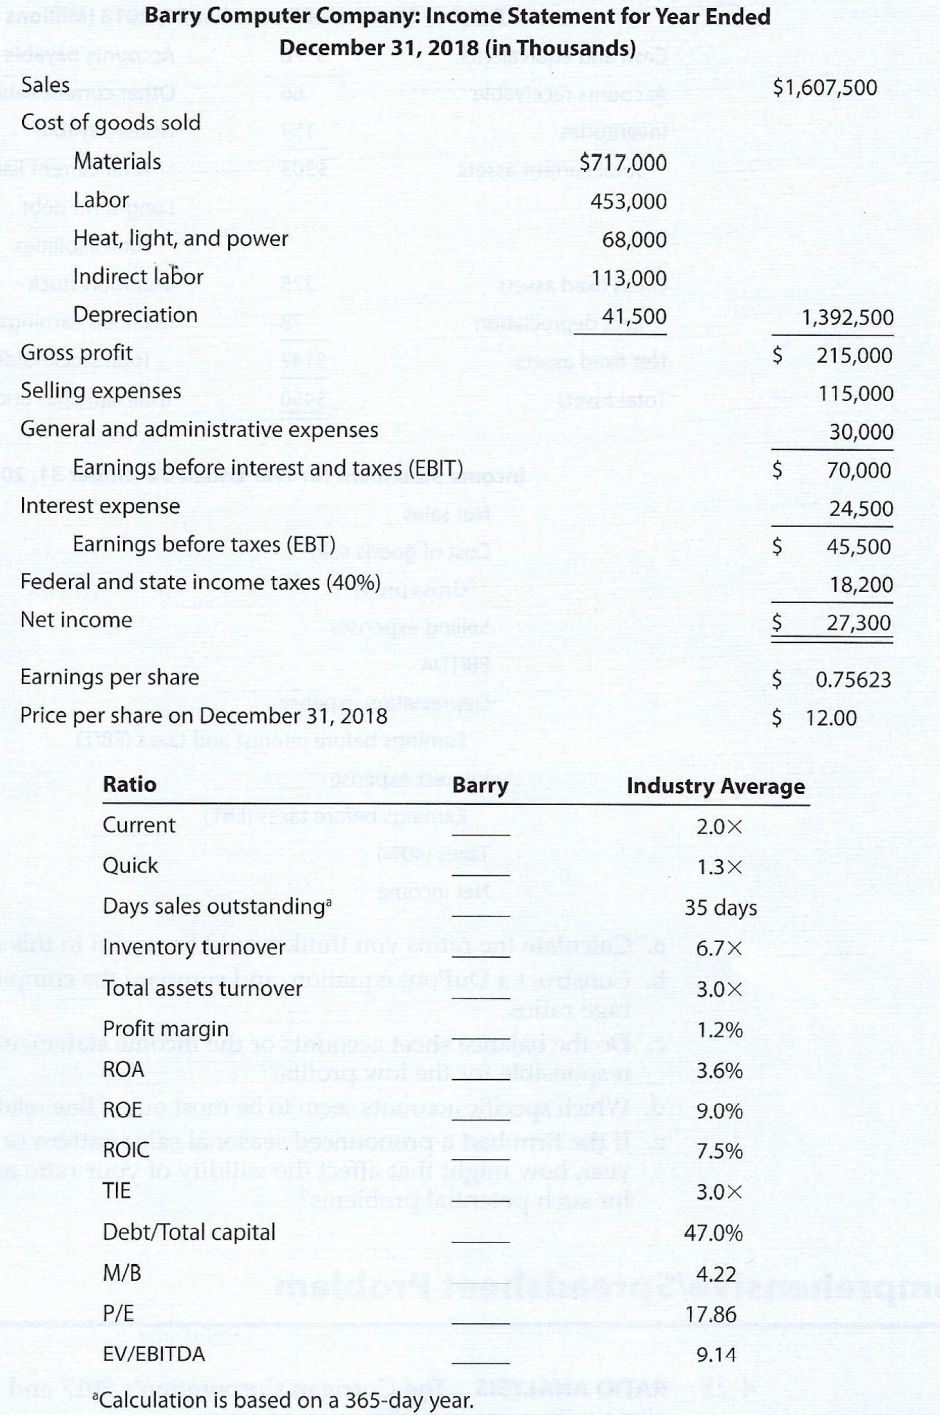
4-23 RATIO ANALYSIS Data for Barry Computer Co. and its industry averages follow. The firm's debt is priced at par, so the market value of its debt equals its book value. Since dol- lars are in thousands, number of shares are shown in thousands too. a. Calculate the indicated ratios for Barry. b. Construct the DuPont equation for both Barry and the industry. c. Outline Barry's strengths and weaknesses as revealed by your analysis. d. Suppose Barry had doubled its sales as well as its inventories, accounts receivable, and common equity during 2018. How would that information affect the validity of your ratio analysis? (Hint: Think about averages and the effects of rapid growth on ratios if averages are not used. No calculations are needed.) $129,000 117,000 Barry Computer Company: Balance Sheet as of December 31, 2018 in Thousands) Cash $ 77,500 Accounts payable Receivables 336,000 Other current liabilities Inventories 241,500 Notes payable to bank Total current assets $ 655,000 Total current liabilities Long-term debt Net fixed assets 292,500 Common equity (36,100 shares) Total assets $ 947,500 Total liabilities and equity 84,000 $330,000 256,500 361,000 $947,500 Barry Computer Company: Income Statement for Year Ended December 31, 2018 (in Thousands) Sales $1,607,500 Cost of goods sold Materials $717,000 Labor 453,000 Heat, light, and power 68,000 Indirect labor 113,000 Depreciation 41,500 1,392,500 Gross profit $ 215,000 Selling expenses 115,000 General and administrative expenses 30,000 Earnings before interest and taxes (EBIT) $ 70,000 Interest expense 24,500 Earnings before taxes (EBT) $ 45,500 Federal and state income taxes (40%) 18,200 Net income $ 27,300 $ 0.75623 Earnings per share Price per share on December 31, 2018 $ 12.00 Ratio Barry Industry Average Current 2.0X Quick 1.3X Days sales outstanding 35 days Inventory turnover 6.7X Total assets turnover 3.0x Profit margin 1.2% ROA 3.6% ROE 9.0% ROIC 7.5% TIE 3.0x Debt/Total capital 47.0% M/B 4.22 P/E 17.86 EV/EBITDA 9.14 Calculation is based on a 365-day year
Step by Step Solution
There are 3 Steps involved in it

Get step-by-step solutions from verified subject matter experts