

Question: U += Merge & Center $ % ) fx B D E F G H K L M Problem 10: For the data series provided
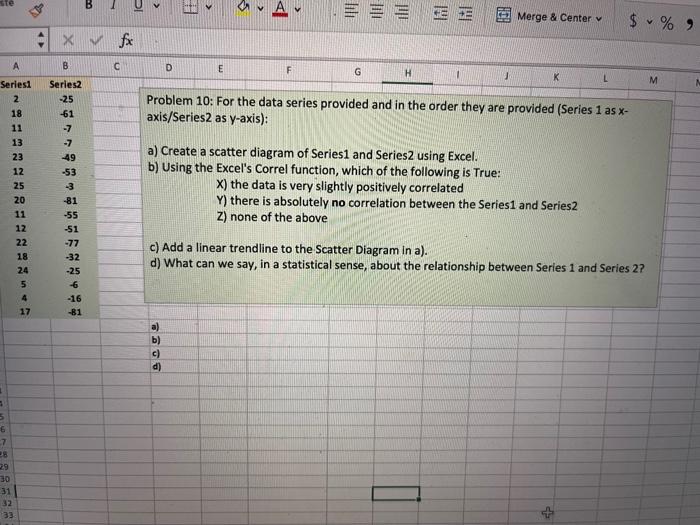
U += Merge & Center $ % ) fx B D E F G H K L M Problem 10: For the data series provided and in the order they are provided (Series 1 as x- axis/Series2 as y-axis): Seriesi 2 18 11 13 23 12 25 20 11 12 22 18 24 5 4 17 Series2 -25 -61 -7 -7 49 -53 -3 -81 -55 -51 -77 -32 -25 -6 a) Create a scatter diagram of Series1 and Series 2 using Excel. b) Using the Excel's Correl function, which of the following is True: X) the data is very slightly positively correlated Y) there is absolutely no correlation between the Series1 and Series2 z) none of the above c) Add a linear trendline to the Scatter Diagram in a). d) What can we say, in a statistical sense, about the relationship between Series 1 and Series 2? -16 -B1 a) b) c) d) 3 5 6 7 29 30 31 32 33
Step by Step Solution
There are 3 Steps involved in it

Get step-by-step solutions from verified subject matter experts