

Question: U the graph below show the persistent negative UUP gap In the U5 tollowrng the Great Recession FREnn Illa-I Potential Gross Domestic Product ' '
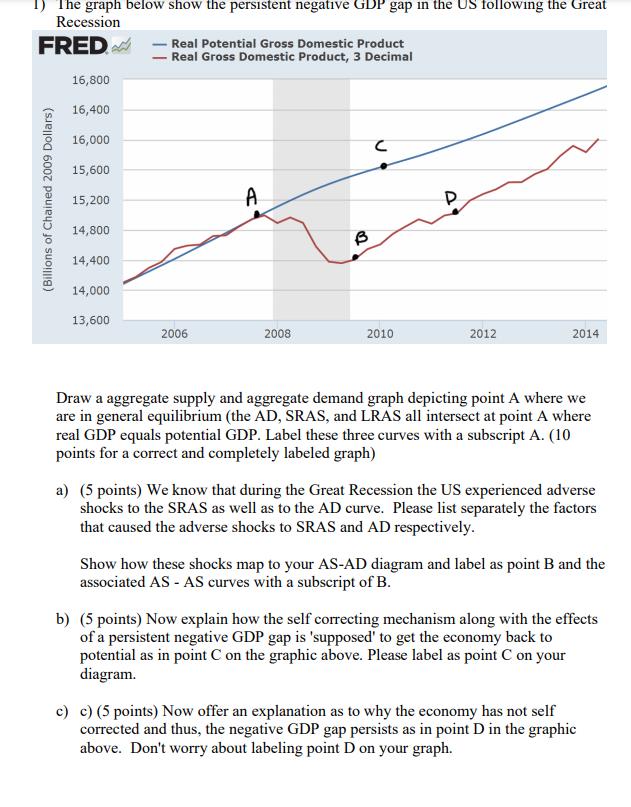
U the graph below show the persistent negative UUP gap In the U5 tollowrng the Great Recession FREnn Illa-I Potential Gross Domestic Product ' ' Real Gross Dalmatia Product, 3 Decimal [Bllllcns of Chained 2009 Dollars) 16,800 16,400 16,000 15,600 15.23] 14,500 11-2100 14,000 13.50:: - - - - - 2905 ms 2010 2912 2014 Draw a aggregate supply and aggregate demand graph depicting point A where we are in general equilibrium (the AD, SEAS, and LRAS all intersect at point A where real GD? equals potential GDP. Label these three curves with a subscript A. (10 points for a correct and completely labeled graph) a) {5 points) We know that during the Great Recession the US experienced adverse shocks to the ERAS as well as to the AD curve. Please List separately the factors that caused the 1de shocks to SRAS and AD respectively. Show how these shocks map to your AS-AD diagram and label as point B and the associated AS - AS curves with a subscript of B. b) {5 points) Now explain how the self correcting mechanism along with the effects of a persistent negative GDP gap is 'supposed' to get the economy hack to potential as in point C on the graphic above. Please label as point C on your diagram. c) c) (5 points} Now offer an explanation as to why the economy has not self corrected and thUs. the uegativa GDP gap persists as in point D in the graphic above. Don*t worry about labeling point D on your graph
Step by Step Solution
There are 3 Steps involved in it

Get step-by-step solutions from verified subject matter experts