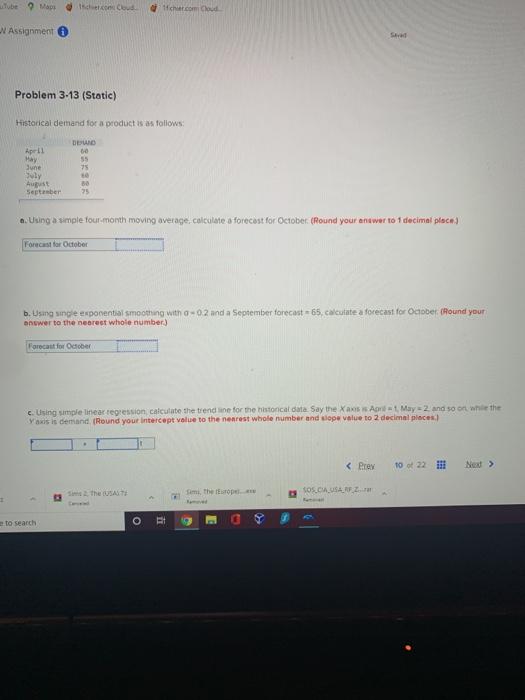
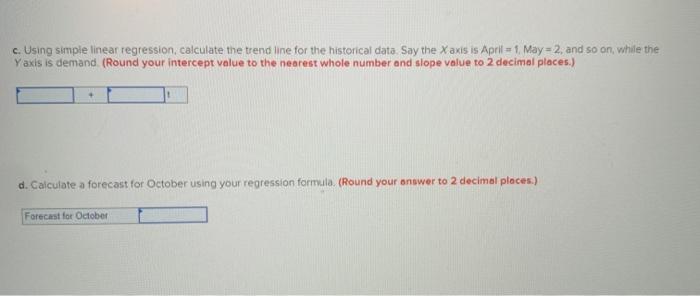
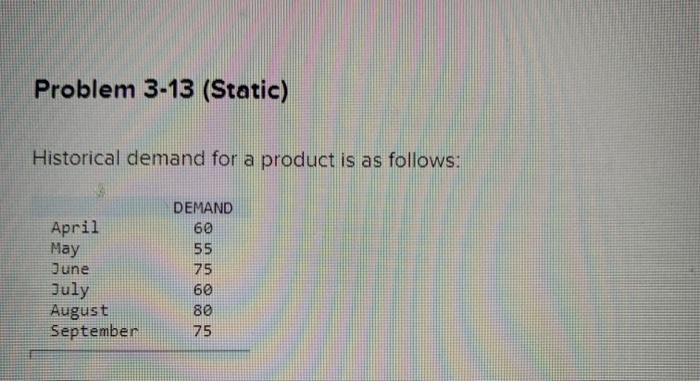
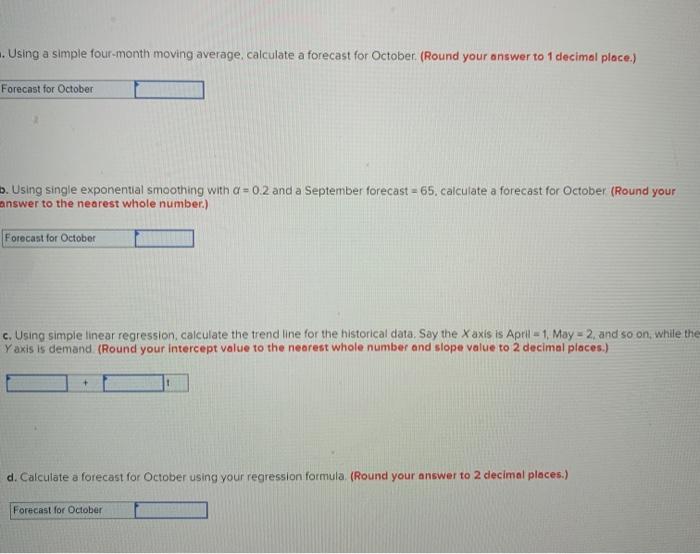
Question: ube Maps concoud chat.comCloud Assignment Sad Problem 3-13 (Static) Historical demand for a product is as follows: DEWO 60 55 75 April May June July

ube Maps concoud chat.comCloud Assignment Sad
ube Maps concoud chat.comCloud Assignment Sad Problem 3-13 (Static) Historical demand for a product is as follows: DEWO 60 55 75 April May June July August September 35 a. Using a simple four month moving average calculate a forecast for October (Round your answer to 1 decimal place) Forecast for October b. Using single exponential smoothing witho-02 and a September forecast - 65. calculate a forecast for October Round your answer to the nearest whole number) Forecast for October c. Using simple linear regression calculate the trendline for the histoncal data Say the Xams And 1 May - 2. and so on while the Yaxis is demand (Round your intercept value to the nearest whole number and clope value to 2 decimal places) the USASTI Siem, the if idopriate SOS CAUSA to search o c. Using simple linear regression, calculate the trend line for the historical data Say the X axis is April = 1. May = 2, and so on, while the Yaxis is demand (Round your intercept value to the nearest whole number and slope value to 2 decimal places.) d. Calculate a forecast for October using your regression formule. (Round your answer to 2 decimal places.) Forecast for October Problem 3-13 (Static) Historical demand for a product is as follows: April May Dune July August September DEMAND 60 55 75 60 80 75 Using a simple four-month moving average calculate a forecast for October (Round your answer to 1 decimal place.) Forecast for October 6. Using single exponential smoothing with a = 0.2 and a September forecast = 65, calculate a forecast for October (Round your answer to the nearest whole number.) Forecast for October c. Using simple linear regression, calculate the trend line for the historical data. Say the Xaxis is April = 1, May - 2, and so on while the Yaxis is demand (Round your intercept value to the nearest whole number and slope value to 2 decimal places.) d. Calculate a forecast for October using your regression formula (Round your answer to 2 decimal places.) Forecast for October

Step by Step Solution

There are 3 Steps involved in it

1 Expert Approved Answer
Step: 1 Unlock blur-text-image
Question Has Been Solved by an Expert!

Get step-by-step solutions from verified subject matter experts

Step: 2 Unlock
Step: 3 Unlock

Students Have Also Explored These Related General Management Questions!