

Question: Uber Eats, a food delivery service, has recently expanded to your area. The accompanying table contains the number of deliveries per month that you demand
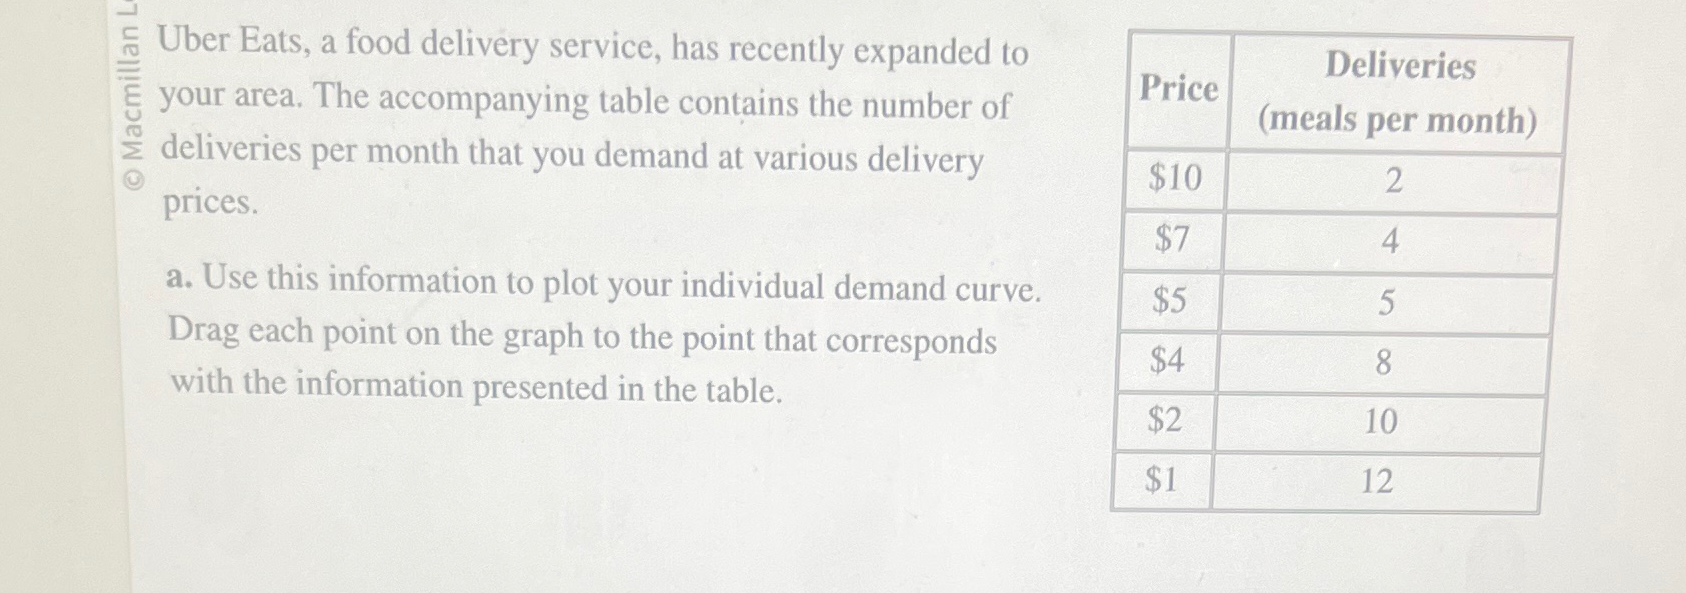
Uber Eats, a food delivery service, has recently expanded to your area. The accompanying table contains the number of deliveries per month that you demand at various delivery prices.
a Use this information to plot your individual demand curve. Drag each point on the graph to the point that corresponds with the information presented in the table.
tablePricetableDeliveriesmeals per month$$$$$$
Step by Step Solution
There are 3 Steps involved in it
1 Expert Approved Answer
Step: 1 Unlock

To plot the individual demand curve using the data from the table follow these steps ... View full answer
Question Has Been Solved by an Expert!
Get step-by-step solutions from verified subject matter experts
Step: 2 Unlock
Step: 3 Unlock