

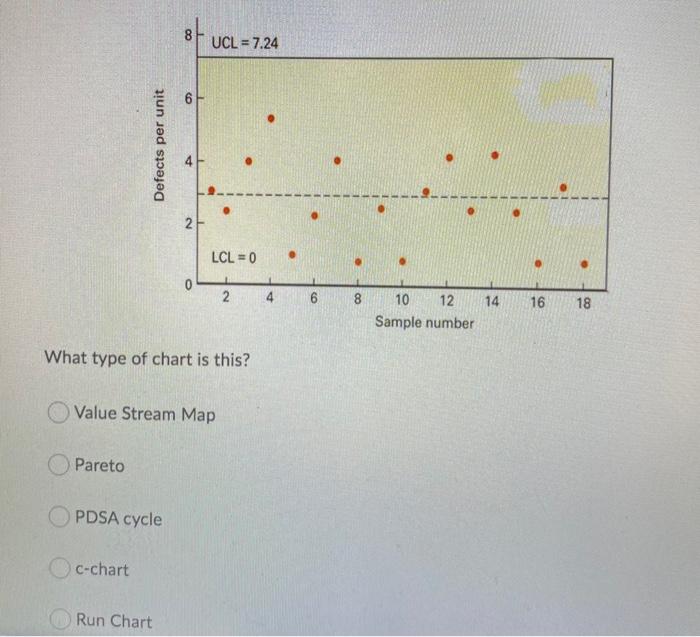
Question: UCL = 7.24 6 Defects per unit N LCL = 0 0 2 4 6 8 8 14 16 18 10 12 Sample number What
Step by Step Solution
There are 3 Steps involved in it
1 Expert Approved Answer
Step: 1 Unlock

Question Has Been Solved by an Expert!
Get step-by-step solutions from verified subject matter experts
Step: 2 Unlock
Step: 3 Unlock