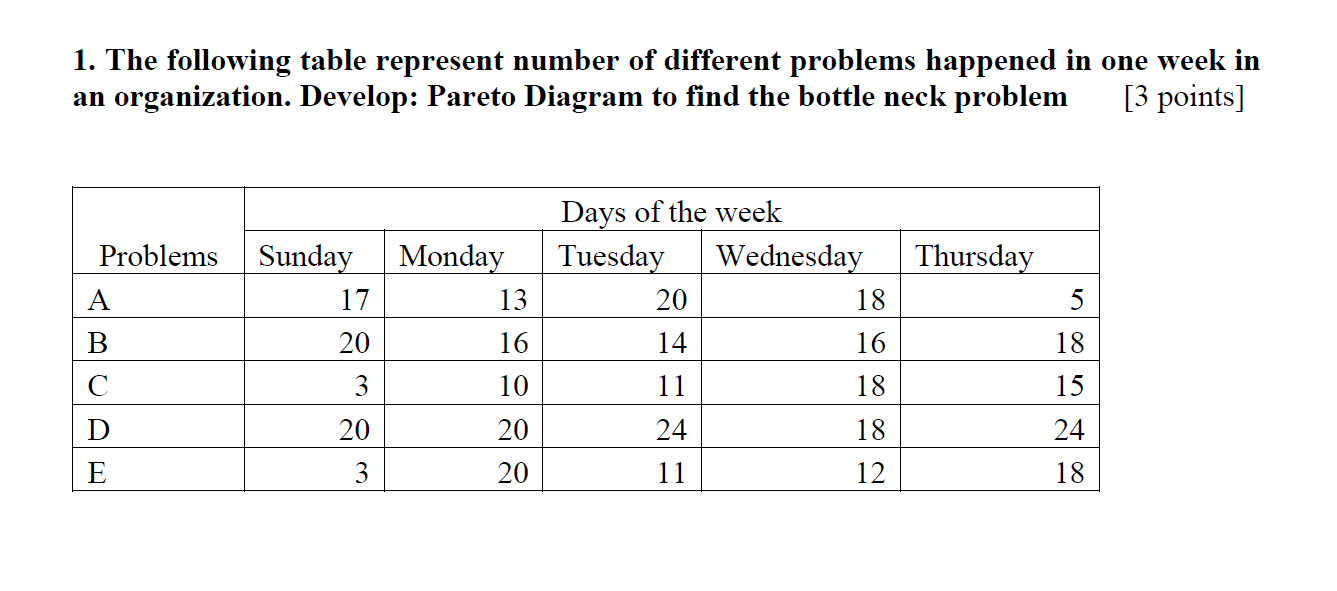
Question: undefined 1. The following table represent number of different problems happened in one week in an organization. Develop: Pareto Diagram to find the bottle neck

undefined 1. The following table represent numberundefined

1. The following table represent number of different problems happened in one week in an organization. Develop: Pareto Diagram to find the bottle neck problem [3 points] Problems Thursday Monday 13 A 5 B. Sunday 17 20 3 20 16 Days of the week Tuesday Wednesday 20 18 14 16 11 18 24 18 11 12 18 10 20 20 15 24 D E 3 18

Step by Step Solution

There are 3 Steps involved in it

1 Expert Approved Answer
Step: 1 Unlock blur-text-image
Question Has Been Solved by an Expert!

Get step-by-step solutions from verified subject matter experts

Step: 2 Unlock
Step: 3 Unlock

Students Have Also Explored These Related General Management Questions!