

Question: undefined (10 points) Consider training set accuracy and test set accuracy curves plotted below as a function of the number of nodes in a decision
 undefined
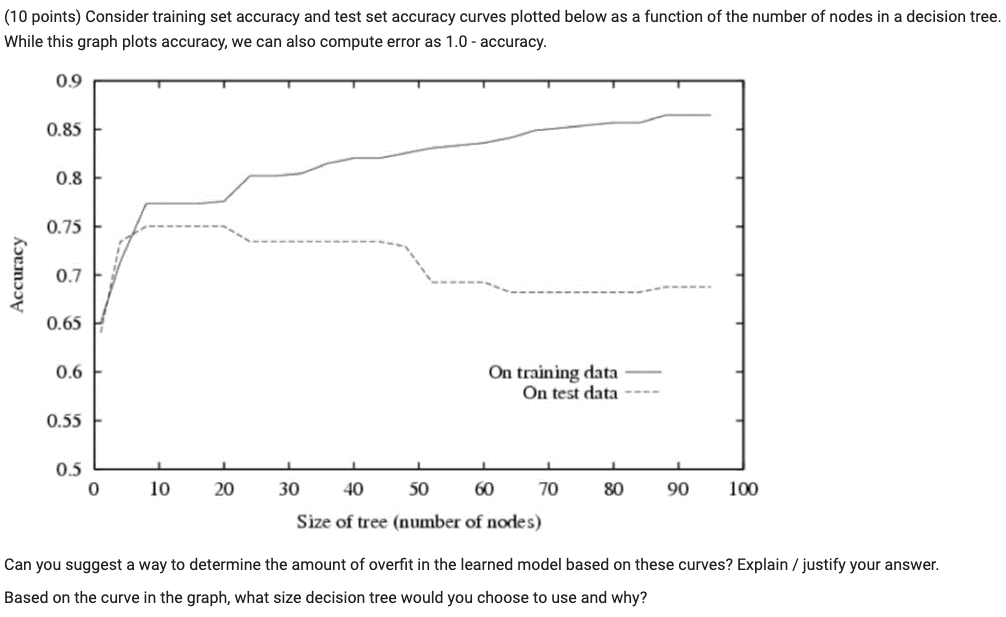
(10 points) Consider training set accuracy and test set accuracy curves plotted below as a function of the number of nodes in a decision tree. While this graph plots accuracy, we can also compute error as 1.0 - accuracy. 0.9 0.85 0.8 0.75 Accuracy 0.7 0.65 0.6 On training data On test data 0.55 0.5 0 10 20 30 40 50 60 70 80 90 100 Size of tree (number of nodes) Can you suggest a way to determine the amount of overfit in the learned model based on these curves? Explain / justify your answer. Based on the curve in the graph, what size decision tree would you choose to use and why? (10 points) Consider training set accuracy and test set accuracy curves plotted below as a function of the number of nodes in a decision tree. While this graph plots accuracy, we can also compute error as 1.0 - accuracy. 0.9 0.85 0.8 0.75 Accuracy 0.7 0.65 0.6 On training data On test data 0.55 0.5 0 10 20 30 40 50 60 70 80 90 100 Size of tree (number of nodes) Can you suggest a way to determine the amount of overfit in the learned model based on these curves? Explain / justify your answer. Based on the curve in the graph, what size decision tree would you choose to use and why
Step by Step Solution
There are 3 Steps involved in it

Get step-by-step solutions from verified subject matter experts