

Question: undefined AutoSave OFF DOO Chapter 3 Lab Templates (2) Q- Search Sheet Home Insert Page Layout Formulas Data Review View Share Insert Arial 10 A-
 undefined
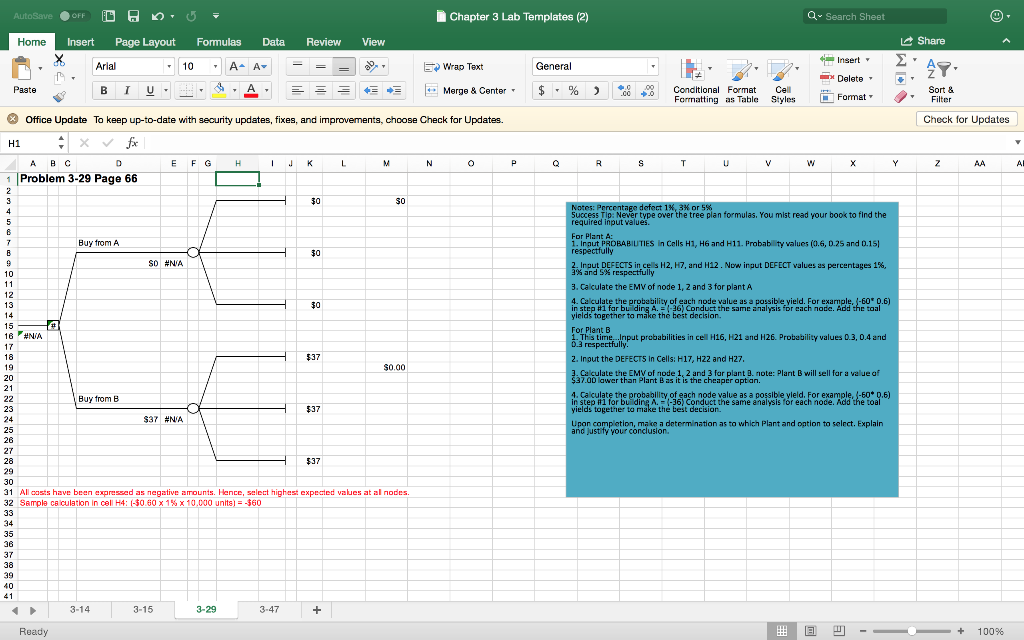
AutoSave OFF DOO Chapter 3 Lab Templates (2) Q- Search Sheet Home Insert Page Layout Formulas Data Review View Share Insert Arial 10 A- A- Wrap Text General Paste BIU U- = = Merge & Center - % 08 Conditional Format Formatting as Table Cell Styles Delete Format > Sort & Filter Check for Updates P R S T U V w Y Z AL Office Update To keep up-to-date with security updates, fixes, and improvements, choose Check for Updates. H1 1 x x D E F G H ! J K L M N 1 Problem 3-29 Page 66 2 3 30 SO 4 5 Notes: Percentage defect 1%, 3% or 5% Success Tip: Never type over the tree plan formulas. You mist read your book to find the required input values. For Plant A: 1. Innut PROBABIUTIES in Calls H1, H6 and H11. Probab ty values (0.6, D.25 and 0.15 respectfully 3% and 5% respectfully 2. Inout DEFECTS inces H2, H7, and H:12. Now input DEFECT values as percentages 1%, 3. Calculate the EMV of node 1, 2 and 3 for planta 4. Calculate the probability of each node value as a possible yield. For example, 3-60*0.6) in step #1 far bu ding A. (26) Conduct the same analysis for each node. Add the taal yields together to make the best decision. For Plants 7 Buy from A B 30 SO #NA 10 11 12 13 30 14 15 # 16 WNIA 17 18 $37 19 $0.00 20 21 22 Buy from 23 $37 $ 24 $37 #N/A 25 26 27 28 $37 29 30 31 All casts have been expressed as negative amounts. Hence, select highes: expected values at al nodes. 32 Sample calculation in cel H4: 1-30.60 X 18 X 10.000 units) = -560 33 34 35 36 37 38 39 40 41 3-14 3-15 3-47 + 1. This time. Input probabilities in cel H16, H21 and H26. Probability values 0.3, 0.4 and 0.3 respectfully 2. Inout the DEFECTS in Cells: H17 H22 and H27. 3. Calculate the EMV of node 1, 2 and 3 for plant B. note: Plant B will sell for a value of $37.00 lawer than Plant B as it is the cheaper aptian 4. Calculate the probability of each node value as a possible yield. For example, 5-500.6) in step #1 for bu dine A. (-36) Conduct the same analysis for each noce. Add the coal yields together to make the best decision Upon completion, make a determination as to which plant and option to select. Explain and justify your conclusion Ready !! 100% AutoSave OFF DOO Chapter 3 Lab Templates (2) Q- Search Sheet Home Insert Page Layout Formulas Data Review View Share Insert Arial 10 A- A- Wrap Text General Paste BIU U- = = Merge & Center - % 08 Conditional Format Formatting as Table Cell Styles Delete Format > Sort & Filter Check for Updates P R S T U V w Y Z AL Office Update To keep up-to-date with security updates, fixes, and improvements, choose Check for Updates. H1 1 x x D E F G H ! J K L M N 1 Problem 3-29 Page 66 2 3 30 SO 4 5 Notes: Percentage defect 1%, 3% or 5% Success Tip: Never type over the tree plan formulas. You mist read your book to find the required input values. For Plant A: 1. Innut PROBABIUTIES in Calls H1, H6 and H11. Probab ty values (0.6, D.25 and 0.15 respectfully 3% and 5% respectfully 2. Inout DEFECTS inces H2, H7, and H:12. Now input DEFECT values as percentages 1%, 3. Calculate the EMV of node 1, 2 and 3 for planta 4. Calculate the probability of each node value as a possible yield. For example, 3-60*0.6) in step #1 far bu ding A. (26) Conduct the same analysis for each node. Add the taal yields together to make the best decision. For Plants 7 Buy from A B 30 SO #NA 10 11 12 13 30 14 15 # 16 WNIA 17 18 $37 19 $0.00 20 21 22 Buy from 23 $37 $ 24 $37 #N/A 25 26 27 28 $37 29 30 31 All casts have been expressed as negative amounts. Hence, select highes: expected values at al nodes. 32 Sample calculation in cel H4: 1-30.60 X 18 X 10.000 units) = -560 33 34 35 36 37 38 39 40 41 3-14 3-15 3-47 + 1. This time. Input probabilities in cel H16, H21 and H26. Probability values 0.3, 0.4 and 0.3 respectfully 2. Inout the DEFECTS in Cells: H17 H22 and H27. 3. Calculate the EMV of node 1, 2 and 3 for plant B. note: Plant B will sell for a value of $37.00 lawer than Plant B as it is the cheaper aptian 4. Calculate the probability of each node value as a possible yield. For example, 5-500.6) in step #1 for bu dine A. (-36) Conduct the same analysis for each noce. Add the coal yields together to make the best decision Upon completion, make a determination as to which plant and option to select. Explain and justify your conclusion Ready !! 100%
Step by Step Solution
There are 3 Steps involved in it

Get step-by-step solutions from verified subject matter experts