

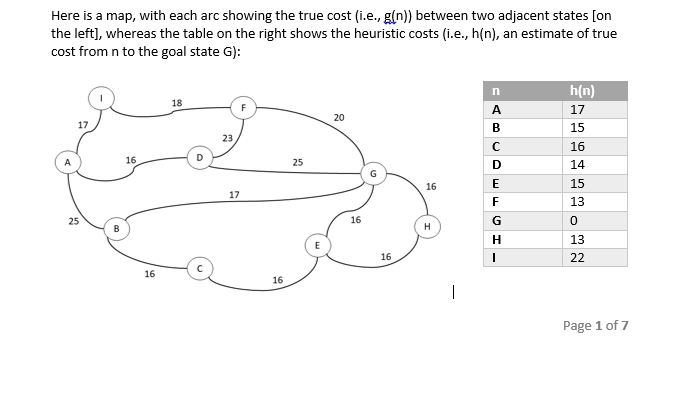
Question: undefined Here is a map, with each arc showing the true cost (i.e., g(n)) between two adjacent states [on the left), whereas the table on
 undefined
Here is a map, with each arc showing the true cost (i.e., g(n)) between two adjacent states [on the left), whereas the table on the right shows the heuristic costs (i.e., h(n), an estimate of true cost from n to the goal state G): n 18 F h(n) 17 15 20 17 23 A B D 16 16 25 14 16 E 17 15 13 F 25 16 0 H H 13 22 16 I 16 16 | Page 1 of 7
Step by Step Solution
There are 3 Steps involved in it
1 Expert Approved Answer
Step: 1 Unlock

Question Has Been Solved by an Expert!
Get step-by-step solutions from verified subject matter experts
Step: 2 Unlock
Step: 3 Unlock