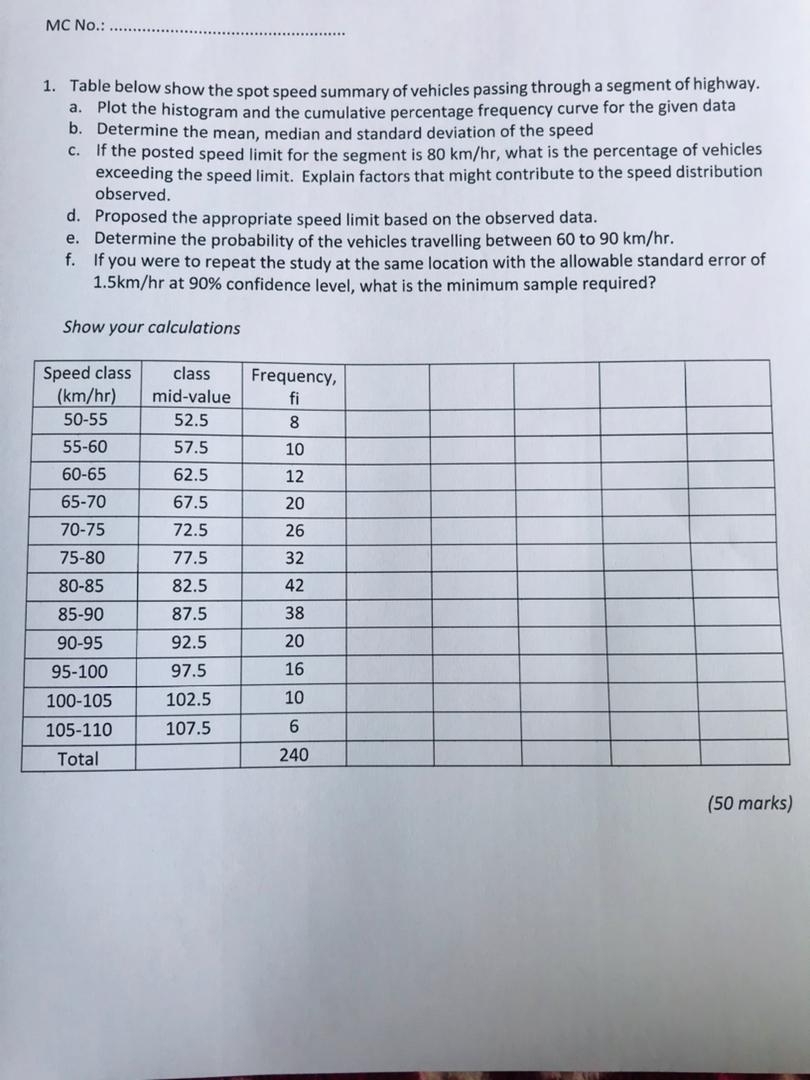
Question: undefined MC No.: 1. Table below show the spot speed summary of vehicles passing through a segment of highway. a. Plot the histogram and the

undefined MC No.: 1. Table below show the spotundefined

MC No.: 1. Table below show the spot speed summary of vehicles passing through a segment of highway. a. Plot the histogram and the cumulative percentage frequency curve for the given data b. Determine the mean, median and standard deviation of the speed C. If the posted speed limit for the segment is 80 km/hr, what is the percentage of vehicles exceeding the speed limit. Explain factors that might contribute to the speed distribution observed. d. Proposed the appropriate speed limit based on the observed data. e. Determine the probability of the vehicles travelling between 60 to 90 km/hr. f. If you were to repeat the study at the same location with the allowable standard error of 1.5km/hr at 90% confidence level, what is the minimum sample required? Show your calculations Speed class (km/hr) 50-55 55-60 class mid-value 52.5 57.5 Frequency, fi 8 10 62.5 67.5 72.5 60-65 65-70 70-75 75-80 80-85 85-90 12 20 26 32 77.5 82.5 42 87.5 38 92.5 20 97.5 16 90-95 95-100 100-105 105-110 Total 102.5 10 107.5 6 240 (50 marks)

Step by Step Solution

There are 3 Steps involved in it

1 Expert Approved Answer
Step: 1 Unlock blur-text-image
Question Has Been Solved by an Expert!

Get step-by-step solutions from verified subject matter experts

Step: 2 Unlock
Step: 3 Unlock

Students Have Also Explored These Related General Management Questions!