

Question: undefined Modeling Problem - Wind Farm Development Part 1 - Developing your Mathematical Model (Written Solution) Problem: Zee's Alternative Energies was founded in 2000 to
 undefined
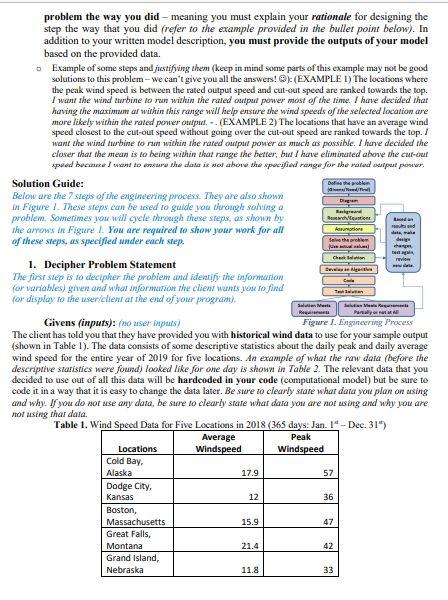
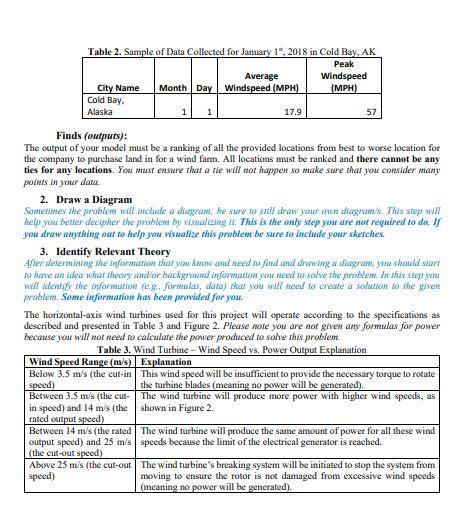
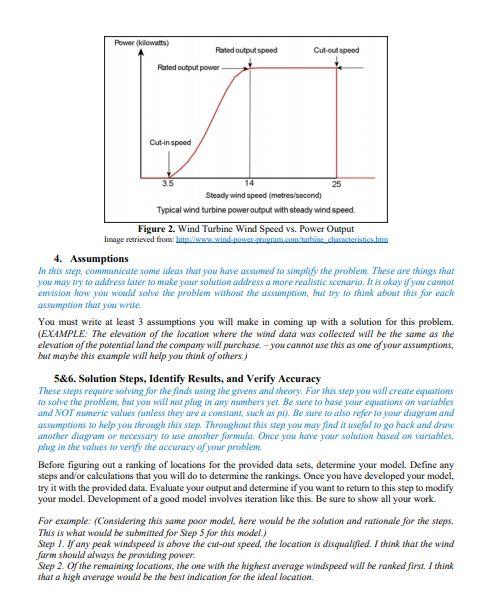
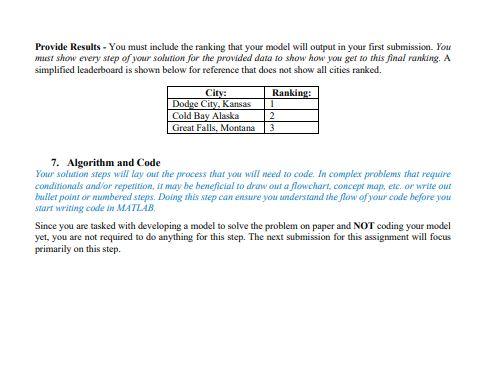
Modeling Problem - Wind Farm Development Part 1 - Developing your Mathematical Model (Written Solution) Problem: Zee's Alternative Energies was founded in 2000 to increase the use of alternative energies across the United States. The company has been extremely successful with their development of solar energy farms. They are expanding and looking to develop a wind farm of horizontal-axis wind turbines. You have been hired by Zee's Alternative Energies to develop a reusable computational model that will determine the best location to build a wind turbine farm based on historical wind data. The company has provided you with some descriptive statistics for a few locations that they are considering. They will send more data for potentially more locations later for further analysis. Since they are in the data collection process they would like to know: If you could have other information about the potential shipping companies, what information would you like? (Answer this question at the top of your submitted proposalsubmission). Currently, you will be provided the historical data for average and peak windspeed. Later on, Zee's Altemative Energies will want a computer program, which will require you to write code: THAT WILL NOT BE AN ACCEPTABLE SUBMISSION FOR THIS PHASE OF DEVELOPMENT THOUGH. Prior to writing any code, Zee's Alternative Energies wants you to EXPLAIN your model for selecting the best location. You must submit a typed response to describe your model to the company. (Note: If your class has a standardized algorithm format, you must use it for this submission. If not, you may use any form for your step by step directions, and you may supplement your directions with a diagram, flowchart, or some other drawing) In addition to your written solution, you must provide your predicted rankings for the cities that are provided. Keep in mind your solution must be developed in a way that it will work for various locations (meaning your solution should make sense for locations with different values and it should be easy to change the data in your code). Submissions: Please note that the submission for this assignment is different than any of your homework assignments. This modeling problem is worth 10% of your grade. This submission is worth 4% of your final grade, hence it requires more work than usual. This submission is a typed model to solve this problem, as described in this document. It will be due in about two weeks. You will complete this submission as a team of two that you choose or by yourself (refer to Canvas for exact dates). Later you will receive another assignment to further this problem for two other submissions: these future assignments will be individual only. (2nd submission: pseudo code algorithm; 3rd submission: coded solution - computational model). (Part 1 due first) Your model description - for this submission you must complete the Engineering Process (steps 1 to 6 only), as described in the document. Your submission MUST BE TYPED and a Word or PDF file. Submissions written on paper will NOT be accepted. You must also follow these additional guidelines: Keep in mind assumptions will be very important for your user to understand the constraints and limitations for using your solution. For your solution step (Step 5), you must explain why you solved the Beli See the ale sis deg Charlton review problem the way you did - meaning you must explain your rationale for designing the step the way that you did (refer to the example provided in the bullet point below). In addition to your written model description, you must provide the outputs of your model based on the provided data. Example of some steps and justifying them (keep in mind some parts of this example may not be good solutions to this problem-we can't give you all the answers! ) (EXAMPLE 1) The locations where the peak wind speed is between the rated output speed and cut-out speed are ranked towards the top. I want the wind turbine to run within the rated output power most of the time. I have decided that having the maximum ar within this range will help ensure the wind speeds of the selected location are more likely within the rated power output. - (EXAMPLE 2) The locations that have an average wind speed closest to the cut-out speed without going over the cut-out speed are ranked towards the top. I want the wind turbine to run within the rated output power as much as possible. I have decided the closer that the mean is to being within that range the better, but I have eliminated above the cut-our pued because I want to ensure the data is not above the specified range for the roled output power Solution Guide: Dore the problem Below are the 7 steps of the engineering process. They are also shown In Figure I. These steps can be used to guide you through sohinga problem. Sometimes you will gele through these steps, as shown by the arrows in Figure 1. You are required to show your work for all of these steps, as specified under each step. 1. Decipher Problem Statement The first step is to decipher the problem and identify the informarion for variables) given and what information the client wants you to find for display to the user client at the end of your program) Swasta Jewel Re Givens (inputs): (no user inputs) Figure 1. Engineering Process The client has told you that they have provided you with historical wind data to use for your sample output (shown in Table 1). The data consists of some descriptive statistics about the daily peak and daily average wind speed for the entire year of 2019 for five locations. An example of what the raw data (before the descriptive statistics were found) looked like for one day is shown in Table 2. The relevant data that you decided to use out of all this data will be hardcoded in your code (computational model) but be sure to code it in a way that it is easy to change the data later. Be sure to clearly state what data you plan on using und why. If you do not use any data, be sure to clearly state whar data you are not using and why you are not using thar data Table 1. Wind Speed Data for Five Locations in 2018 (365 days: Jan. 1 - Dec. 31") Average Peak Locations Windspeed Windspeed Cold Bay, Alaska Dodge City, Kansas Boston, Massachusetts Great Falls, Montana Grand Island, Nebraska ayor AB 17.9 57 12 36 15.9 47 21.4 42 11.8 33 Table 2. Sample of Data Collected for January 14, 2018 in Cold Bay, AK Peak Average Windspeed City Name Month Day Windspeed (MPH) (MPH) Cold Bay, Alaska 57 17.9 Finds outputs): The output of your model must be a ranking of all the provided locations from best to worse location for the company to purchase land in for a wind farm. All locations must be ranked and there cannot be any ties for any locations. You must ensure that a tie will not happen so make sure that you consider many points in your data 2. Draw a Diagram Somerimes the problem will include a diagram, be sure to still draw your own diagrams. This step will help you better decipher the problem by visualizing it. This is the only step you are not required to do. If you draw anything out to help you visualize this problem be sure to include your sketches. 3. Identify Relevant Theory After determining the information that you know and need to find and drawing a diagram, you should stari to have an idea what theory and or background information you need to solve the problem. In this step you will identify the information (eg, formulas, data) thar wou will need to create a solution to the given problem. Some information has been provided for you. The horizontal-axis wind turbines used for this project will operate according to the specifications as described and presented in Table 3 and Figure 2. Please note you are not given any formulas for power because you will not need to calculate the power produced to solve this problem. Table 3. Wind Turbine - Wind Speed vs. Power Output Explanation Wind Speed Range (m/s) Explanation Below 3.5 m's (the cut-in This wind speed will be insufficient to provide the necessary torque to rotate speed) the turbine blades (meaning no power will be generated). Between 3.5 m/s (the cut- The wind turbine will produce more power with higher Wind speeds, as in speed) and 14 m/s (the shown in Figure 2. rated output speed) Between 14 m's (the rated the wind turbine will produce the same amount of power for all these wind output speed) and 25 ms speeds because the limit of the electrical generator is reached. (the cut-out speed) Above 25 m/s (the cut-out The wind turbine's breaking system will be initiated to stop the system from speed) moving to ensure the rotor is not damaged from excessive wind speeds (meaning no power will be generated). Cut-out speed Power (kilowatts) Rated output speed Rated output power Cut-in speed 25 35 14 Steady wind speed (metres/second) Typical wind turbine power output with steady wind speed, Figure 2. Wind Turbine Wind Speed vs. Power Output Image retrieved from but wind power-gram.com turbine characteristics.htm 4. Assumptions In this step, communicate some ideas that you have assumed to simplif the problem. These are things that You may try to address later to make your solution address a more realistic scenario. It is okay if you cannor envision how you would selve the problem without the assumption, but try to think bemut this for each assumption that you will You must write at least 3 assumptions you will make in coming up with a solution for this problem. (EXAMPLE. The elevation of the location where the wind data was collected will be the same as the elevation of the potential land the company will prerchase. - you cannot use this as one of your assumptions, But maybe this example will help you think of others.) 5&6. Solution Steps, Identify Results and Verify Accuracy These steps require solving for the finds using the givens and theory. For this step you will create equations to solve the problem, but you will not plug in any numbers yet. Be sure to base your equations on wariables and NOT anteric values (unless they are a constant, such as pi). Be sure to also refer to your diagram and assumptions to help you through this step. Throughout this step vetr may find ir arseful to go back and drow another diagram or necessary to tese another formula. Once you have your solution based on variables. plug in the values to verify the accuracy of your problem Before figuring out a ranking of locations for the provided data sets, determine your model. Define any steps and or calculations that you will do to determine the rankings. Once you have developed your model, try it with the provided data. Evaluate your output and determine if you want to return to this step to modify your model. Development of a good model involves iteration like this. Be sure to show all your work. For example (Considering this same poor model, here would be the solution and rationale for the steps. This is what would be submitted for Step 3 for this model) Step 1. If any peak windspeed is above the cut-out speed, the location is disqualified. I think that the wind farm should always be providing power. Step 2. Of the remaining locations, the one with the highest average windspeed will be ranked first. I think that a high average would be the best indication for the ideal location. Provide Results - You must include the ranking that your model will output in your first submission. You test show every step of your solution for the provided data to show how you get to this final ranking. A simplified leaderboard is shown below for reference that does not show all cities ranked. City: Ranking Dodge City, Kansas 1 Cold Bay Alaska 2 Great Falls, Montana 3 7. Algorithm and Code Your solution steps will lay out the process that you will need to code. In complex problems that require conditionals and/or repetition, ir may be beneficial to draw out a flowchart concept maps, etc. or write one bullet point or numbered steps. Doing this step can ensure you understand the flow of your code before you start writing code In MATLAB Since you are tasked with developing a model to solve the problem on paper and NOT coding your model yet, you are not required to do anything for this step. The next submission for this assignment will focus primarily on this step. Modeling Problem - Wind Farm Development Part 1 - Developing your Mathematical Model (Written Solution) Problem: Zee's Alternative Energies was founded in 2000 to increase the use of alternative energies across the United States. The company has been extremely successful with their development of solar energy farms. They are expanding and looking to develop a wind farm of horizontal-axis wind turbines. You have been hired by Zee's Alternative Energies to develop a reusable computational model that will determine the best location to build a wind turbine farm based on historical wind data. The company has provided you with some descriptive statistics for a few locations that they are considering. They will send more data for potentially more locations later for further analysis. Since they are in the data collection process they would like to know: If you could have other information about the potential shipping companies, what information would you like? (Answer this question at the top of your submitted proposalsubmission). Currently, you will be provided the historical data for average and peak windspeed. Later on, Zee's Altemative Energies will want a computer program, which will require you to write code: THAT WILL NOT BE AN ACCEPTABLE SUBMISSION FOR THIS PHASE OF DEVELOPMENT THOUGH. Prior to writing any code, Zee's Alternative Energies wants you to EXPLAIN your model for selecting the best location. You must submit a typed response to describe your model to the company. (Note: If your class has a standardized algorithm format, you must use it for this submission. If not, you may use any form for your step by step directions, and you may supplement your directions with a diagram, flowchart, or some other drawing) In addition to your written solution, you must provide your predicted rankings for the cities that are provided. Keep in mind your solution must be developed in a way that it will work for various locations (meaning your solution should make sense for locations with different values and it should be easy to change the data in your code). Submissions: Please note that the submission for this assignment is different than any of your homework assignments. This modeling problem is worth 10% of your grade. This submission is worth 4% of your final grade, hence it requires more work than usual. This submission is a typed model to solve this problem, as described in this document. It will be due in about two weeks. You will complete this submission as a team of two that you choose or by yourself (refer to Canvas for exact dates). Later you will receive another assignment to further this problem for two other submissions: these future assignments will be individual only. (2nd submission: pseudo code algorithm; 3rd submission: coded solution - computational model). (Part 1 due first) Your model description - for this submission you must complete the Engineering Process (steps 1 to 6 only), as described in the document. Your submission MUST BE TYPED and a Word or PDF file. Submissions written on paper will NOT be accepted. You must also follow these additional guidelines: Keep in mind assumptions will be very important for your user to understand the constraints and limitations for using your solution. For your solution step (Step 5), you must explain why you solved the Beli See the ale sis deg Charlton review problem the way you did - meaning you must explain your rationale for designing the step the way that you did (refer to the example provided in the bullet point below). In addition to your written model description, you must provide the outputs of your model based on the provided data. Example of some steps and justifying them (keep in mind some parts of this example may not be good solutions to this problem-we can't give you all the answers! ) (EXAMPLE 1) The locations where the peak wind speed is between the rated output speed and cut-out speed are ranked towards the top. I want the wind turbine to run within the rated output power most of the time. I have decided that having the maximum ar within this range will help ensure the wind speeds of the selected location are more likely within the rated power output. - (EXAMPLE 2) The locations that have an average wind speed closest to the cut-out speed without going over the cut-out speed are ranked towards the top. I want the wind turbine to run within the rated output power as much as possible. I have decided the closer that the mean is to being within that range the better, but I have eliminated above the cut-our pued because I want to ensure the data is not above the specified range for the roled output power Solution Guide: Dore the problem Below are the 7 steps of the engineering process. They are also shown In Figure I. These steps can be used to guide you through sohinga problem. Sometimes you will gele through these steps, as shown by the arrows in Figure 1. You are required to show your work for all of these steps, as specified under each step. 1. Decipher Problem Statement The first step is to decipher the problem and identify the informarion for variables) given and what information the client wants you to find for display to the user client at the end of your program) Swasta Jewel Re Givens (inputs): (no user inputs) Figure 1. Engineering Process The client has told you that they have provided you with historical wind data to use for your sample output (shown in Table 1). The data consists of some descriptive statistics about the daily peak and daily average wind speed for the entire year of 2019 for five locations. An example of what the raw data (before the descriptive statistics were found) looked like for one day is shown in Table 2. The relevant data that you decided to use out of all this data will be hardcoded in your code (computational model) but be sure to code it in a way that it is easy to change the data later. Be sure to clearly state what data you plan on using und why. If you do not use any data, be sure to clearly state whar data you are not using and why you are not using thar data Table 1. Wind Speed Data for Five Locations in 2018 (365 days: Jan. 1 - Dec. 31") Average Peak Locations Windspeed Windspeed Cold Bay, Alaska Dodge City, Kansas Boston, Massachusetts Great Falls, Montana Grand Island, Nebraska ayor AB 17.9 57 12 36 15.9 47 21.4 42 11.8 33 Table 2. Sample of Data Collected for January 14, 2018 in Cold Bay, AK Peak Average Windspeed City Name Month Day Windspeed (MPH) (MPH) Cold Bay, Alaska 57 17.9 Finds outputs): The output of your model must be a ranking of all the provided locations from best to worse location for the company to purchase land in for a wind farm. All locations must be ranked and there cannot be any ties for any locations. You must ensure that a tie will not happen so make sure that you consider many points in your data 2. Draw a Diagram Somerimes the problem will include a diagram, be sure to still draw your own diagrams. This step will help you better decipher the problem by visualizing it. This is the only step you are not required to do. If you draw anything out to help you visualize this problem be sure to include your sketches. 3. Identify Relevant Theory After determining the information that you know and need to find and drawing a diagram, you should stari to have an idea what theory and or background information you need to solve the problem. In this step you will identify the information (eg, formulas, data) thar wou will need to create a solution to the given problem. Some information has been provided for you. The horizontal-axis wind turbines used for this project will operate according to the specifications as described and presented in Table 3 and Figure 2. Please note you are not given any formulas for power because you will not need to calculate the power produced to solve this problem. Table 3. Wind Turbine - Wind Speed vs. Power Output Explanation Wind Speed Range (m/s) Explanation Below 3.5 m's (the cut-in This wind speed will be insufficient to provide the necessary torque to rotate speed) the turbine blades (meaning no power will be generated). Between 3.5 m/s (the cut- The wind turbine will produce more power with higher Wind speeds, as in speed) and 14 m/s (the shown in Figure 2. rated output speed) Between 14 m's (the rated the wind turbine will produce the same amount of power for all these wind output speed) and 25 ms speeds because the limit of the electrical generator is reached. (the cut-out speed) Above 25 m/s (the cut-out The wind turbine's breaking system will be initiated to stop the system from speed) moving to ensure the rotor is not damaged from excessive wind speeds (meaning no power will be generated). Cut-out speed Power (kilowatts) Rated output speed Rated output power Cut-in speed 25 35 14 Steady wind speed (metres/second) Typical wind turbine power output with steady wind speed, Figure 2. Wind Turbine Wind Speed vs. Power Output Image retrieved from but wind power-gram.com turbine characteristics.htm 4. Assumptions In this step, communicate some ideas that you have assumed to simplif the problem. These are things that You may try to address later to make your solution address a more realistic scenario. It is okay if you cannor envision how you would selve the problem without the assumption, but try to think bemut this for each assumption that you will You must write at least 3 assumptions you will make in coming up with a solution for this problem. (EXAMPLE. The elevation of the location where the wind data was collected will be the same as the elevation of the potential land the company will prerchase. - you cannot use this as one of your assumptions, But maybe this example will help you think of others.) 5&6. Solution Steps, Identify Results and Verify Accuracy These steps require solving for the finds using the givens and theory. For this step you will create equations to solve the problem, but you will not plug in any numbers yet. Be sure to base your equations on wariables and NOT anteric values (unless they are a constant, such as pi). Be sure to also refer to your diagram and assumptions to help you through this step. Throughout this step vetr may find ir arseful to go back and drow another diagram or necessary to tese another formula. Once you have your solution based on variables. plug in the values to verify the accuracy of your problem Before figuring out a ranking of locations for the provided data sets, determine your model. Define any steps and or calculations that you will do to determine the rankings. Once you have developed your model, try it with the provided data. Evaluate your output and determine if you want to return to this step to modify your model. Development of a good model involves iteration like this. Be sure to show all your work. For example (Considering this same poor model, here would be the solution and rationale for the steps. This is what would be submitted for Step 3 for this model) Step 1. If any peak windspeed is above the cut-out speed, the location is disqualified. I think that the wind farm should always be providing power. Step 2. Of the remaining locations, the one with the highest average windspeed will be ranked first. I think that a high average would be the best indication for the ideal location. Provide Results - You must include the ranking that your model will output in your first submission. You test show every step of your solution for the provided data to show how you get to this final ranking. A simplified leaderboard is shown below for reference that does not show all cities ranked. City: Ranking Dodge City, Kansas 1 Cold Bay Alaska 2 Great Falls, Montana 3 7. Algorithm and Code Your solution steps will lay out the process that you will need to code. In complex problems that require conditionals and/or repetition, ir may be beneficial to draw out a flowchart concept maps, etc. or write one bullet point or numbered steps. Doing this step can ensure you understand the flow of your code before you start writing code In MATLAB Since you are tasked with developing a model to solve the problem on paper and NOT coding your model yet, you are not required to do anything for this step. The next submission for this assignment will focus primarily on this step
Step by Step Solution
There are 3 Steps involved in it

Get step-by-step solutions from verified subject matter experts