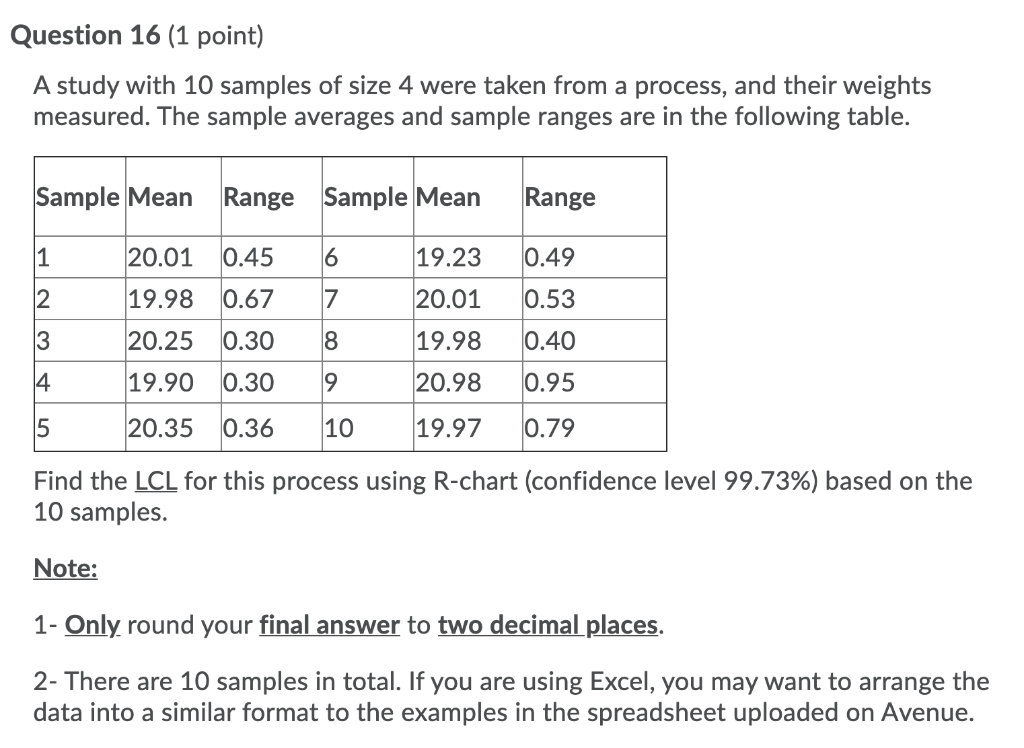
Question: undefined Question 16 (1 point) A study with 10 samples of size 4 were taken from a process, and their weights measured. The sample averages

undefined Question 16 (1 point) A study with 10undefined

Question 16 (1 point) A study with 10 samples of size 4 were taken from a process, and their weights measured. The sample averages and sample ranges are in the following table. Sample Mean Range Sample Mean Range 1 20.01 0.45 6 19.23 0.49 2 19.98 0.67 17 20.01 0.53 3 20.25 0.30 8 19.98 0.40 4 19.90 0.30 9 20.98 0.95 5 20.35 0.36 10 19.97 0.79 Find the LCL for this process using R-chart (confidence level 99.73%) based on the 10 samples. Note: 1- Only round your final answer to two decimal places. 2- There are 10 samples in total. If you are using Excel, you may want to arrange the data into a similar format to the examples in the spreadsheet uploaded on Avenue

Step by Step Solution

There are 3 Steps involved in it

1 Expert Approved Answer
Step: 1 Unlock blur-text-image
Question Has Been Solved by an Expert!

Get step-by-step solutions from verified subject matter experts

Step: 2 Unlock
Step: 3 Unlock

Students Have Also Explored These Related General Management Questions!