

Question: undefined Use the information in the following table to answer Question 32, Question 33 AND Question 34. The table provides 2017 taxation rates for Australia.
 undefined
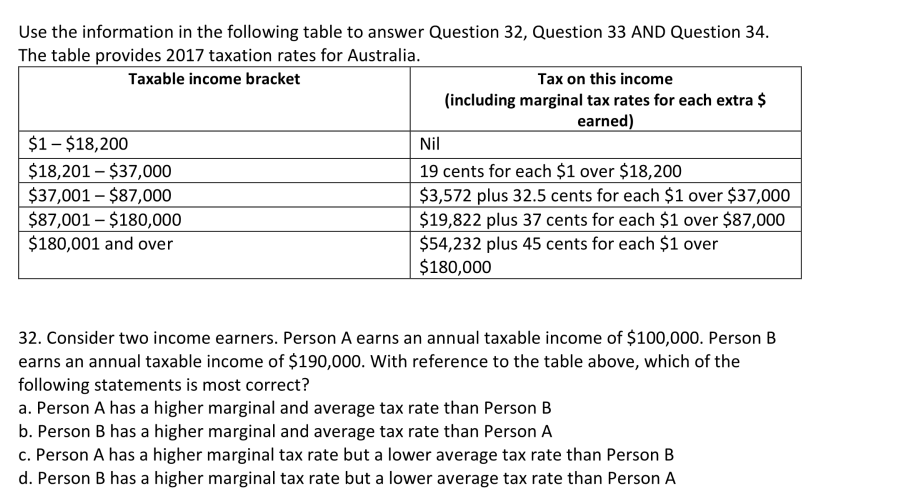
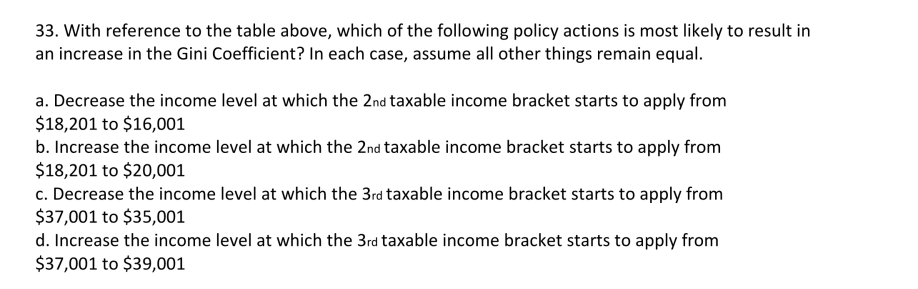
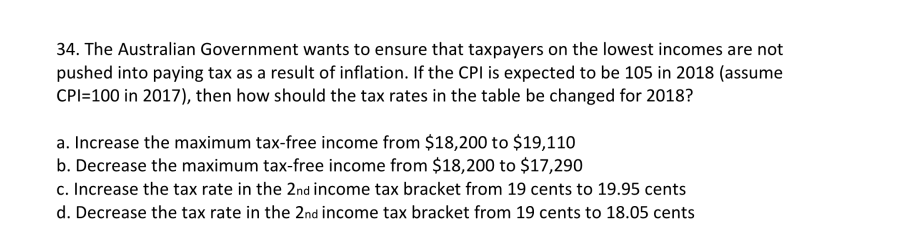
Use the information in the following table to answer Question 32, Question 33 AND Question 34. The table provides 2017 taxation rates for Australia. Taxable income bracket Tax on this income (including marginal tax rates for each extra $ earned) $1 - $18,200 Nil $18,201 - $37,000 19 cents for each $1 over $18,200 $37,001 - $87,000 $3,572 plus 32.5 cents for each $1 over $37,000 $87,001 - $180,000 $19,822 plus 37 cents for each $1 over $87,000 $180,001 and over $54,232 plus 45 cents for each $1 over $180,000 32. Consider two income earners. Person A earns an annual taxable income of $100,000. Person B earns an annual taxable income of $190,000. With reference to the table above, which of the following statements is most correct? a. Person A has a higher marginal and average tax rate than Person B b. Person B has a higher marginal and average tax rate than Person A c. Person A has a higher marginal tax rate but a lower average tax rate than Person B d. Person B has a higher marginal tax rate but a lower average tax rate than Person A 33. With reference to the table above, which of the following policy actions is most likely to result in an increase in the Gini Coefficient? In each case, assume all other things remain equal. a. Decrease the income level at which the 2nd taxable income bracket starts to apply from $18,201 to $16,001 b. Increase the income level at which the 2nd taxable income bracket starts to apply from $18,201 to $20,001 c. Decrease the income level at which the 3rd taxable income bracket starts to apply from $37,001 to $35,001 d. Increase the income level at which the 3rd taxable income bracket starts to apply from $37,001 to $39,001 34. The Australian Government wants to ensure that taxpayers on the lowest incomes are not pushed into paying tax as a result of inflation. If the CPI is expected to be 105 in 2018 (assume CPI=100 in 2017), then how should the tax rates in the table be changed for 2018? a. Increase the maximum tax-free income from $18,200 to $19,110 b. Decrease the maximum tax-free income from $18,200 to $17,290 c. Increase the tax rate in the 2nd income tax bracket from 19 cents to 19.95 cents d. Decrease the tax rate in the 2nd income tax bracket from 19 cents to 18.05 cents
Step by Step Solution
There are 3 Steps involved in it

Get step-by-step solutions from verified subject matter experts