

Question: Under Armour 2018 Case Study Under Armour CEO Kevin Plank has employed you as a consultant to assess the companys overall situation and recommend a
Under Armour 2018 Case Study
Under Armour CEO Kevin Plank has employed you as a consultant to assess the companys overall situation and recommend a set of actions to improve the companys future prospects. Prepare a report to Mr. Plank that includes
(1) an evaluation of the five competitive forces in the global market for performance sports apparel and accessories,
(2) an assessment of Under Armours strengths, weaknesses, opportunities and threats as of early 2018,
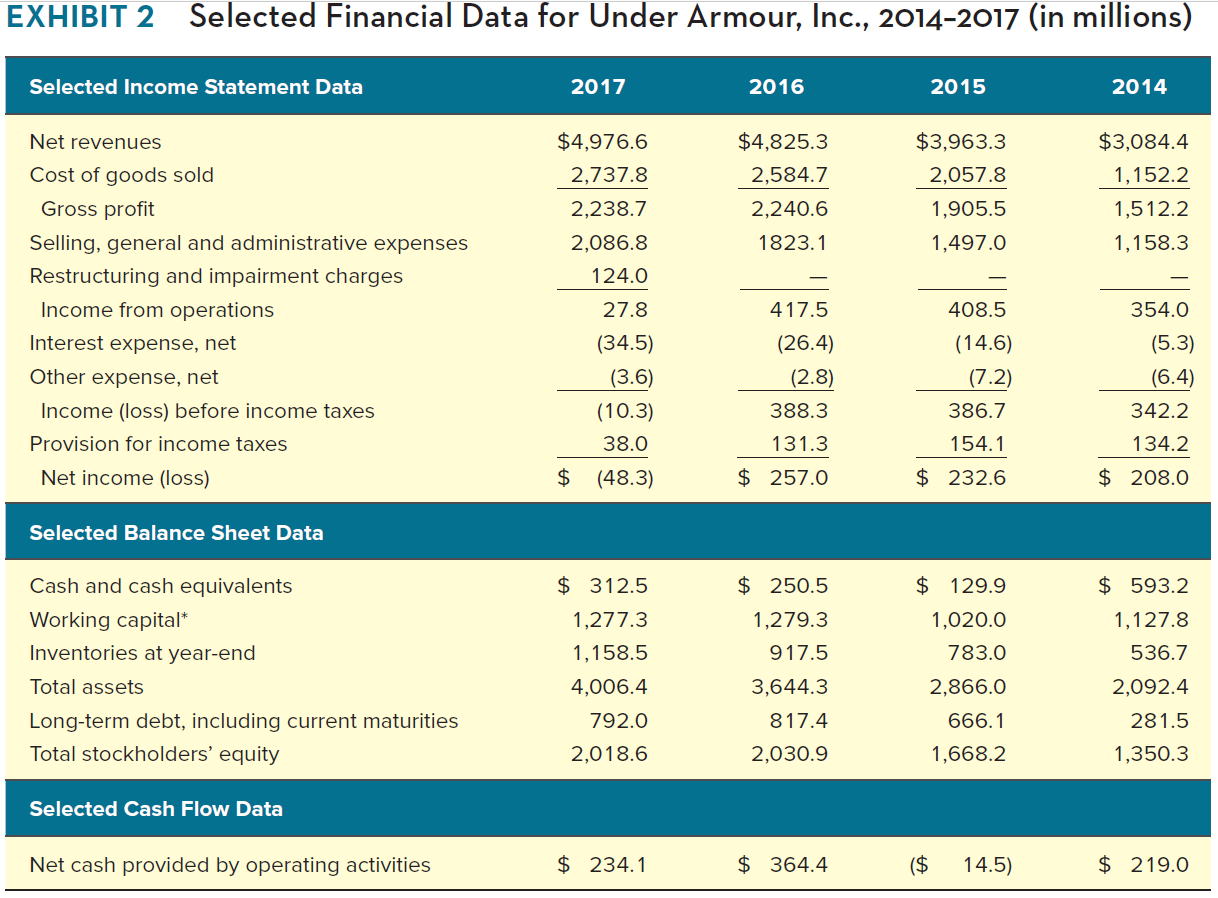
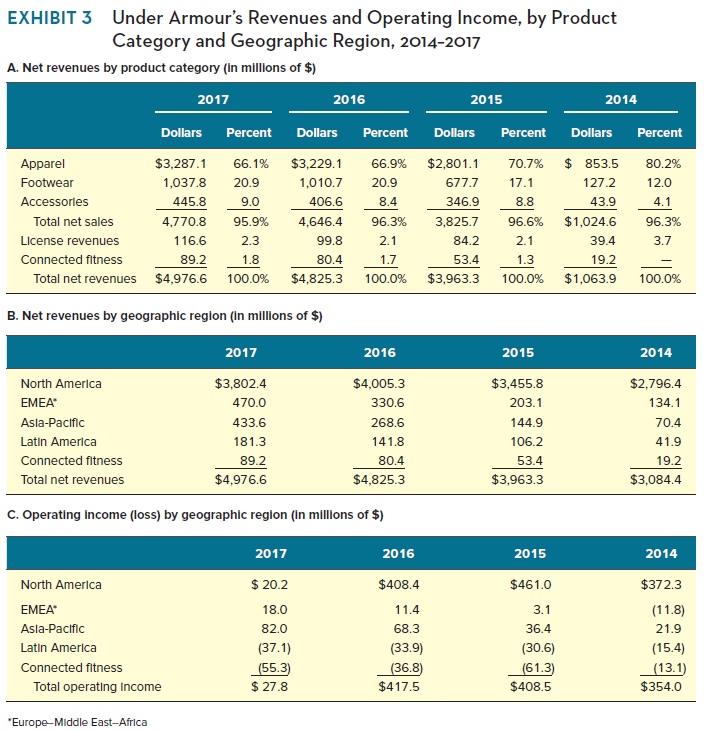
(3) an evaluation of Under Armours financial performance as shown in case Exhibits 1, 2, and 3,
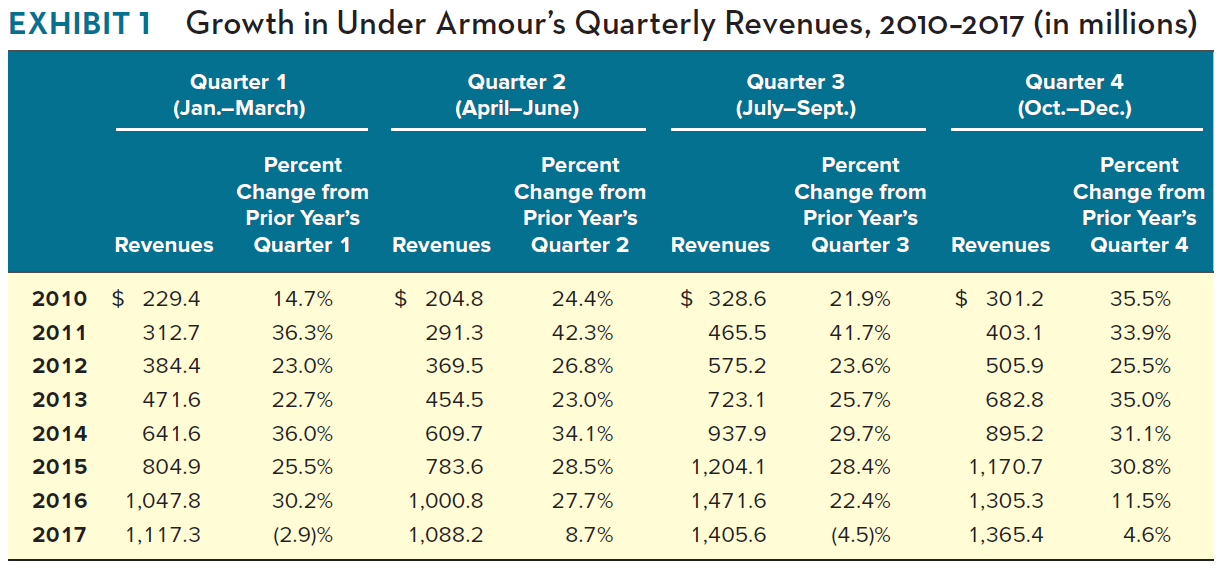 Note: Exhibit 1 Quarter 1 2017 Revenue is 1017.3 instead of 1,117.3
(4) a weighted competitive strength assessment of Under Armour, Nike, and The adidas Group using the methodology in Table 4.4 in Chapter 4, and
(5) a set of action recommendations that clearly define the course of action Under Armour should pursue to get its performance back on track, particularly in North America.
EXHIBITI Growth in Under Armour's Quarterly Revenues, 2010-2017 (in millions) Quarter 1 (Jan.-March) Quarter 2 (April-June) Quarter 3 (July-Sept.) Quarter 4 (Oct.-Dec.) Percent Change from Prior Year's Quarter 1 Percent Change from Prior Year's Quarter 2 Percent Change from Prior Year's Quarter 3 Percent Change from Prior Year's Quarter 4 Revenues Revenues Revenues Revenues 2010 2011 2012 2013 2014 2015 2016 2017 $ 229.4 312.7 384.4 471.6 641.6 804.9 1,047.8 1,117.3 14.7% 36.3% 23.0% 22.7% 36.0% 25.5% 30.2% (2.9)% $ 204.8 291.3 369.5 454.5 609.7 783.6 1,000.8 1,088.2 24.4% 42.3% 26.8% 23.0% 34.1% 28.5% 27.7% 8.7% $ 328.6 465.5 575.2 723.1 937.9 1,204.1 1,471.6 1,405.6 21.9% 41.7% 23.6% 25.7% 29.7% 28.4% 22.4% (4.5)% $ 301.2 403.1 505.9 682.8 895.2 1,170.7 1,305.3 1,365.4 35.5% 33.9% 25.5% 35.0% 31.1% 30.8% 11.5% 4.6% 5.6 EXHIBIT 2 Selected Financial Data for Under Armour, Inc., 2014-2017 (in millions) Selected Income Statement Data 2017 2016 2015 2014 $4,825.3 2,584.7 2,240.6 1823.1 $3,963.3 2,057.8 1,905.5 1,497.0 $3,084.4 1,152.2 1,512.2 1,158.3 - Net revenues Cost of goods sold Gross profit Selling, general and administrative expenses Restructuring and impairment charges Income from operations Interest expense, net Other expense, net Income (loss) before income taxes Provision for income taxes Net income (loss) $4,976.6 2,737.8 2,238.7 2,086.8 124.0 27.8 (34.5) (3.6) (10.3) 38.0 $ (48.3) 417.5 (26.4) (2.8) 388.3 131.3 257.0 408.5 (14.6) (7.2) 386.7 154.1 $ 232.6 354.0 (5.3) (6.4) 342.2 134.2 $ 208.0 $ Selected Balance Sheet Data Cash and cash equivalents Working capital* Inventories at year-end Total assets Long-term debt, including current maturities Total stockholders' equity $ 312.5 1,277.3 1,158.5 4,006.4 792.0 2,018.6 $ 250.5 1,279.3 917.5 3,644.3 817.4 2,030.9 $ 129.9 1,020.0 783.0 2,866.0 666.1 1,668.2 $ 593.2 1,127.8 536.7 2,092.4 281.5 1,350.3 Selected Cash Flow Data Net cash provided by operating activities $ 234.1 $ 364.4 ($ 14.5) $ 219.0 EXHIBIT 3 Under Armour's Revenues and Operating Income, by Product Category and Geographic Region, 2014-2017 A. Net revenues by product category (In millions of $) 2017 2016 2015 2014 Dollars Percent Dollars Percent Dollars Percent Dollars Percent 1 Apparel Footwear Accessories Total net sales License revenues Connected fitness Total net revenues $3,287.1 1,037.8 445.8 4,770.8 116.6 89.2 $4.976.6 66.1% 20. 9 9.0 95.9% 2. 3 1.8 100.0% $3,229.1 ,010.7 406.6 4,646.4 9 9. 8 80.4 $4,825.3 66.9% 20.9 8.4 96.3% 2 . 1 1.7 100.0% $2,801.1 677.7 346.9 3,825.7 84.2 53.4 $3,963.3 70.7% 17.1 8.8 96.6% 2.1 1.3 100.0% $ 853.5 127.2 43.9 $1,024.6 39.4 19.2 $1,063.9 80.2% 12.0 4.1 96.3% 3.7 100.0% B. Net revenues by geographic region (In millions of $) 2017 2016 2015 2014 North America EMEA Asia-Pacific Latin America Connected fitness Total net revenues $3,802.4 470.0 433.6 181.3 89.2 $4,976.6 $4,005.3 330.6 268.6 141.8 80.4 $4,825.3 $3,455.8 203.1 144.9 106.2 53.4 $3,963.3 $2,796.4 134.1 70.4 41.9 19.2 $3,084.4 C. Operating Income (loss) by geographic region (in millions of $) 2017 2016 2015 2014 North America $ 20.2 $408.4 EMEA Asia-Pacific Latin America Connected fitness Total operating Income 18.0 82.0 (37.1) (55.3) $ 27.8 11.4 68.3 (33.9) (36.8) $417.5 $461.0 3.1 36.4 (30.6) (61.3) $408.5 $372.3 (11.8) 21.9 (15.4) (13.1) $354.0 "Europe-Middle East AfricaStep by Step Solution
There are 3 Steps involved in it

Get step-by-step solutions from verified subject matter experts