

Question: Under the assumptions that Ideko's market share will increase by 0.65 percent per year (implying that the investment, financing, and depreciation will be adjusted accordingly)
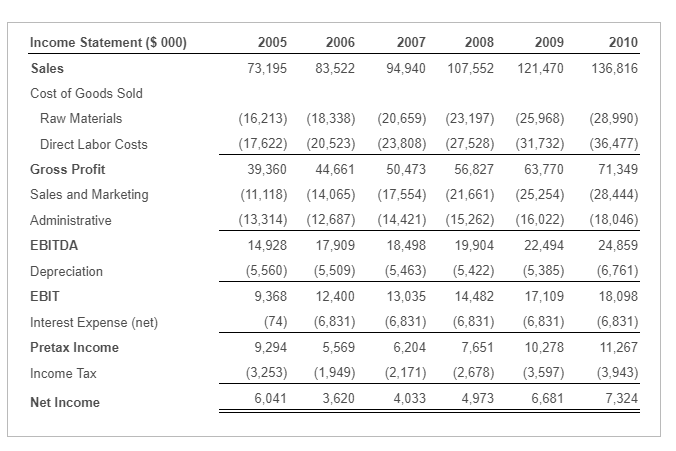
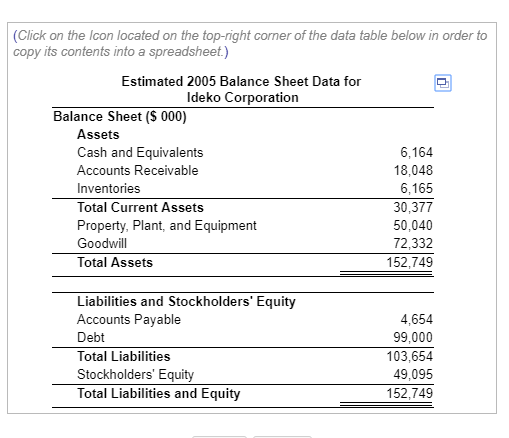
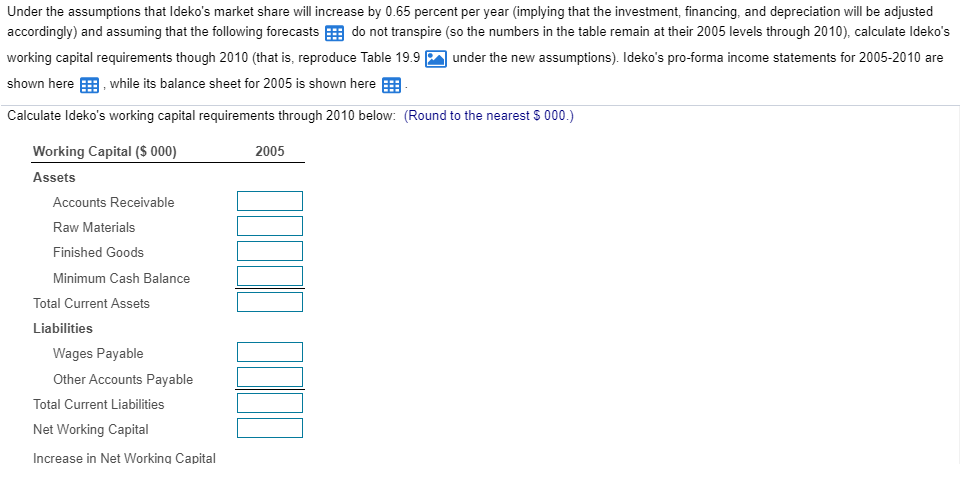
Under the assumptions that Ideko's market share will increase by 0.65 percent per year (implying that the investment, financing, and depreciation will be adjusted accordingly) and assuming that the following forecasts do not transpire (so the numbers in the table remain at their 2005 levels through 2010), calculate Ideko's working capital requirements though 2010 (that is, reproduce Table 19.9 under the new assumptions). Ideko's pro-forma income statements for 2005-2010 are shown here while its balance sheet for 2005 is shown here, Calculate Ideko's working capital requirements from 2005 to 2010 below
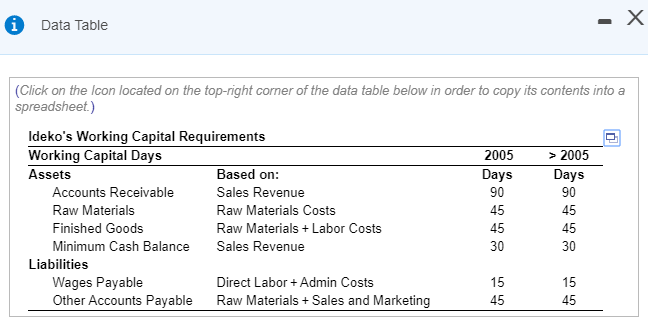
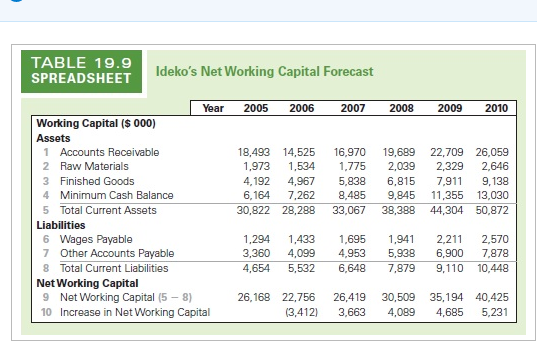
Data Table (Click on the Icon located on the top-right corner of the data table below in order to copy its contents into a spreadsheet) Ideko's Working Capital Requirements Working Capital Days Assets Accounts Receivable Raw Materials Finished Goods Minimum Cash Balance Based on: Sales Revenue Raw Materials Costs Raw Materials Labor Costs Sales Revenue 2005 Days 90 45 45 30 > 2005 Days 90 45 45 30 Liabilities Wages Payable Other Accounts Payable Direct LaborAdmin Costs Raw Materials +Sales and Marketing 45 45 TABLE 19.9 SPREADSHEET Ideko's Net Working Capital Forecast Year 2005 2006 2007 2008 2009 2010 Working Capital ($S 000) Assets 1 Accounts Receivable 2 Raw Materials 3 Finished Goods 18,493 14,525 16,970 19,689 22,709 26,059 1,973 1,534 775 2,039 2,329 2,646 4,192 4,967 5,838 6,815 7,911 9,138 6,164 7,262 8,485 9,845 11,355 13,030 30,822 28,288 33,067 38,388 44,304 50,872 Minimum Cash Balance 5 Total Current Assets Liabilities Wages Payable 7 6 Other Accounts Payable 8 1,294 1,433 1695 1,941 2,211 2,570 3,360 4,099 4,953 5,938 6,900 7,878 4,654 5,532 6,648 7,879 9,110 10,448 Total Current Liabilities Net Working Capital 9 Net Working Capital (5- 8) 10 Increase in Net Working Capital 26,168 22,756 26,419 30,509 35,194 40,425 3,412 3,663 4,089 4,685 5,231 2010 Income Statement ($ 000) Sales Cost of Goods Sold 2005 2006 2007 2008 2009 73,195 83,522 94,940 107,552 121,470 136,816 Raw Materials Direct Labor Costs Gross Profit Sales and Marketing Administrative EBITDA Depreciation EBIT Interest Expense (net) Pretax Income Income Tax Net Income (16,213) 18,338) 20,659) (23,197) (25,968) (28,990) (17,622) 20,523 (23,808) (27,528) (31,732) (36,477) 39,360 44,661 50,473 56,82763,77071,349 (11,118) 14,065 (17,554) (21,661) 25,254) (28,444) 13,314 (12,687) (14,421) (15,262) 16,022) (18,046) 4,928 17,909 18,498 19,90422,494 24,859 (5,560 (5,509) 5,463) 5,422) 5,385) 6,761) 9,368 12,400 13,035 14,482 17,109 18,098 (74) 6,831) (6,831) 6,831) (6,831) 6,831) 9,2945,569 6,204 7,651 10,278 11,267 (3,253) (1,949) (2,171) (2,678) 3,597) (3,943) 7,324 6,041 3,620 4,033 4,973 6,681 (Click on the Icon located on the top-right corner of the data table below in order to copy its contents into a spreadsheet) Estimated 2005 Balance Sheet Data for Ideko Corporation Balance Sheet (S 000) Assets Cash and Equivalents Accounts Receivable Inventories Total Current Assets Property, Plant, and Equipment Goodwill Total Assets 6,164 18,048 6,165 30,377 50,040 72,332 152,749 Liabilities and Stockholders' Equity Accounts Payable Total Liabilities Stockholders' Equity Total Liabilities and Equity 4,654 99,000 103,654 49,095 152,749 Under the assumptions that Ideko's market share will increase by 0.65 percent per year (implying that the investment, financing, and depreciation will be adjusted accordingly and assuming that the following forecastsdo not transpire so the numbers in the table remain at their 2005 levels through 2010 calculate ldeko's working capital requirements though 2010 (that is, reproduce Table 19.9under the new assumptions). Ideko's pro-forma income statements for 2005-2010 are shown here EEB, while its balance sheet for 2005 is shown here EEB Calculate ldeko's working capital requirements through 2010 below: (Round to the nearest $ 000.) Working Capital ($ 000) 2005 Assets Accounts Receivable Raw Materials Finished Goods Minimum Cash Balance Total Current Assets Liabilities Wages Payable Other Accounts Payable Total Current Liabilities Net Working Capital Increase in Net Working Capital Data Table (Click on the Icon located on the top-right corner of the data table below in order to copy its contents into a spreadsheet) Ideko's Working Capital Requirements Working Capital Days Assets Accounts Receivable Raw Materials Finished Goods Minimum Cash Balance Based on: Sales Revenue Raw Materials Costs Raw Materials Labor Costs Sales Revenue 2005 Days 90 45 45 30 > 2005 Days 90 45 45 30 Liabilities Wages Payable Other Accounts Payable Direct LaborAdmin Costs Raw Materials +Sales and Marketing 45 45 TABLE 19.9 SPREADSHEET Ideko's Net Working Capital Forecast Year 2005 2006 2007 2008 2009 2010 Working Capital ($S 000) Assets 1 Accounts Receivable 2 Raw Materials 3 Finished Goods 18,493 14,525 16,970 19,689 22,709 26,059 1,973 1,534 775 2,039 2,329 2,646 4,192 4,967 5,838 6,815 7,911 9,138 6,164 7,262 8,485 9,845 11,355 13,030 30,822 28,288 33,067 38,388 44,304 50,872 Minimum Cash Balance 5 Total Current Assets Liabilities Wages Payable 7 6 Other Accounts Payable 8 1,294 1,433 1695 1,941 2,211 2,570 3,360 4,099 4,953 5,938 6,900 7,878 4,654 5,532 6,648 7,879 9,110 10,448 Total Current Liabilities Net Working Capital 9 Net Working Capital (5- 8) 10 Increase in Net Working Capital 26,168 22,756 26,419 30,509 35,194 40,425 3,412 3,663 4,089 4,685 5,231 2010 Income Statement ($ 000) Sales Cost of Goods Sold 2005 2006 2007 2008 2009 73,195 83,522 94,940 107,552 121,470 136,816 Raw Materials Direct Labor Costs Gross Profit Sales and Marketing Administrative EBITDA Depreciation EBIT Interest Expense (net) Pretax Income Income Tax Net Income (16,213) 18,338) 20,659) (23,197) (25,968) (28,990) (17,622) 20,523 (23,808) (27,528) (31,732) (36,477) 39,360 44,661 50,473 56,82763,77071,349 (11,118) 14,065 (17,554) (21,661) 25,254) (28,444) 13,314 (12,687) (14,421) (15,262) 16,022) (18,046) 4,928 17,909 18,498 19,90422,494 24,859 (5,560 (5,509) 5,463) 5,422) 5,385) 6,761) 9,368 12,400 13,035 14,482 17,109 18,098 (74) 6,831) (6,831) 6,831) (6,831) 6,831) 9,2945,569 6,204 7,651 10,278 11,267 (3,253) (1,949) (2,171) (2,678) 3,597) (3,943) 7,324 6,041 3,620 4,033 4,973 6,681 (Click on the Icon located on the top-right corner of the data table below in order to copy its contents into a spreadsheet) Estimated 2005 Balance Sheet Data for Ideko Corporation Balance Sheet (S 000) Assets Cash and Equivalents Accounts Receivable Inventories Total Current Assets Property, Plant, and Equipment Goodwill Total Assets 6,164 18,048 6,165 30,377 50,040 72,332 152,749 Liabilities and Stockholders' Equity Accounts Payable Total Liabilities Stockholders' Equity Total Liabilities and Equity 4,654 99,000 103,654 49,095 152,749 Under the assumptions that Ideko's market share will increase by 0.65 percent per year (implying that the investment, financing, and depreciation will be adjusted accordingly and assuming that the following forecastsdo not transpire so the numbers in the table remain at their 2005 levels through 2010 calculate ldeko's working capital requirements though 2010 (that is, reproduce Table 19.9under the new assumptions). Ideko's pro-forma income statements for 2005-2010 are shown here EEB, while its balance sheet for 2005 is shown here EEB Calculate ldeko's working capital requirements through 2010 below: (Round to the nearest $ 000.) Working Capital ($ 000) 2005 Assets Accounts Receivable Raw Materials Finished Goods Minimum Cash Balance Total Current Assets Liabilities Wages Payable Other Accounts Payable Total Current Liabilities Net Working Capital Increase in Net Working Capital
Step by Step Solution
There are 3 Steps involved in it

Get step-by-step solutions from verified subject matter experts