

Question: Under the assumptions that Ideko's market share will increase by 0.50 percent per year (implying that the investment, financing, and depreciation will be adjusted accordingly)
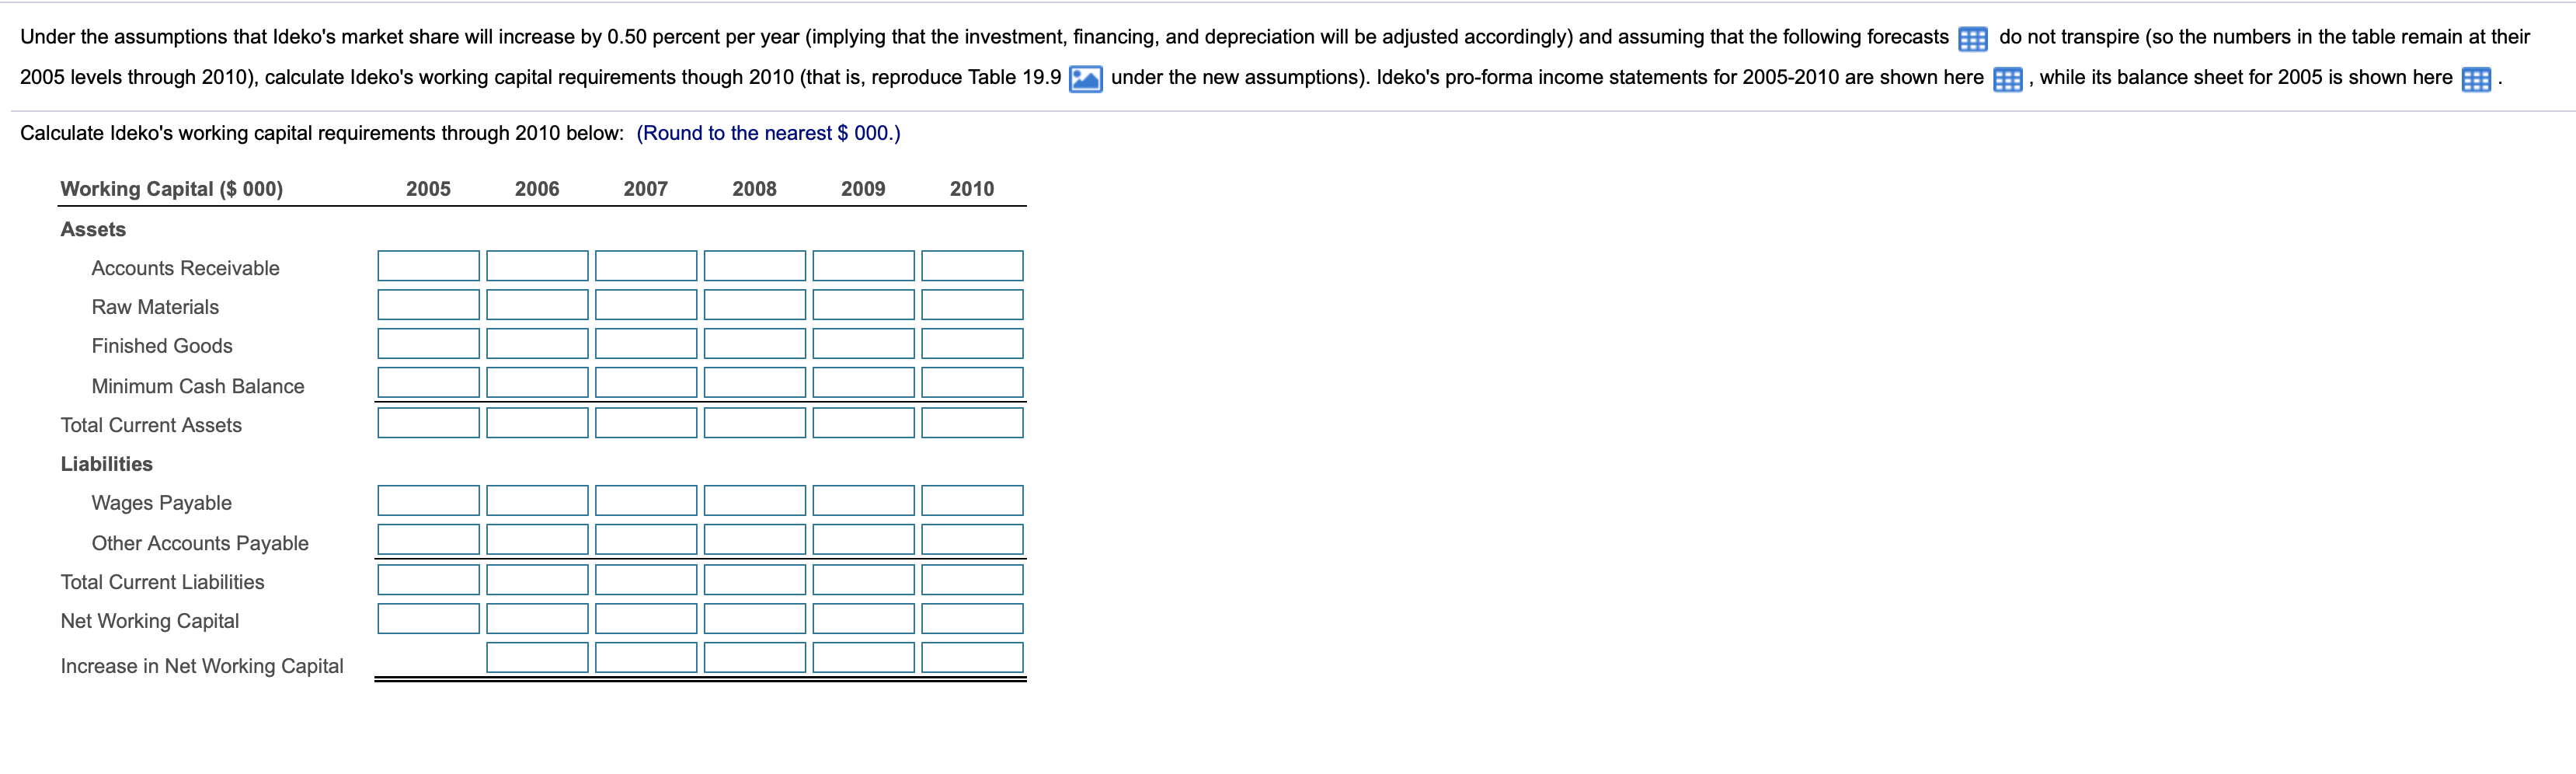
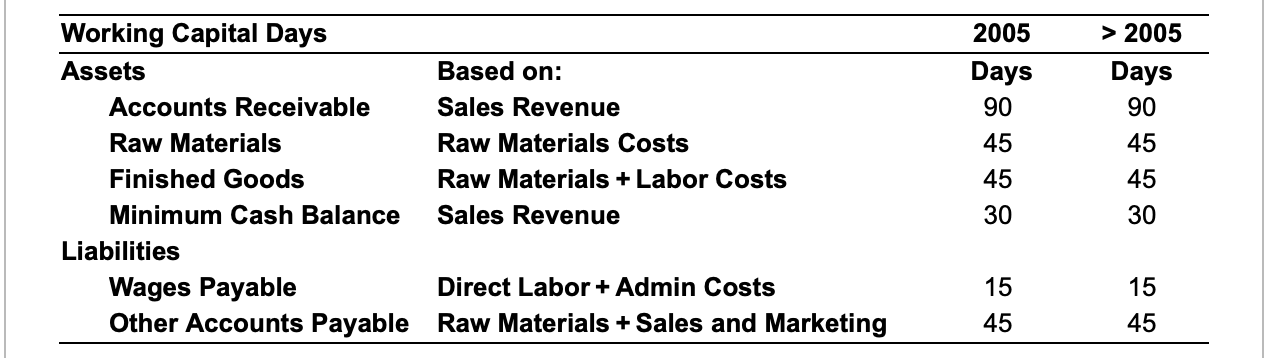
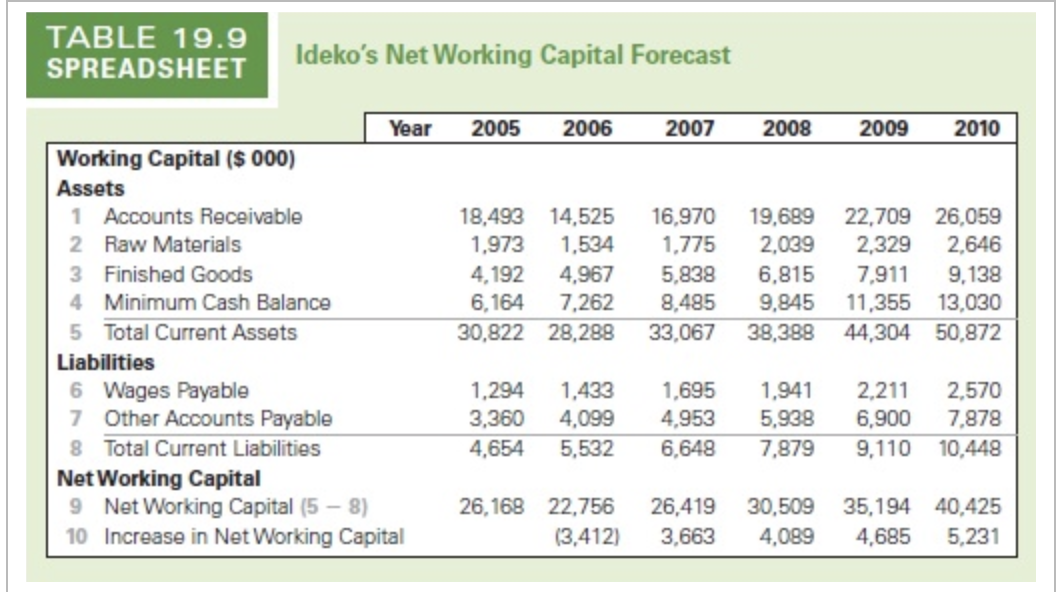
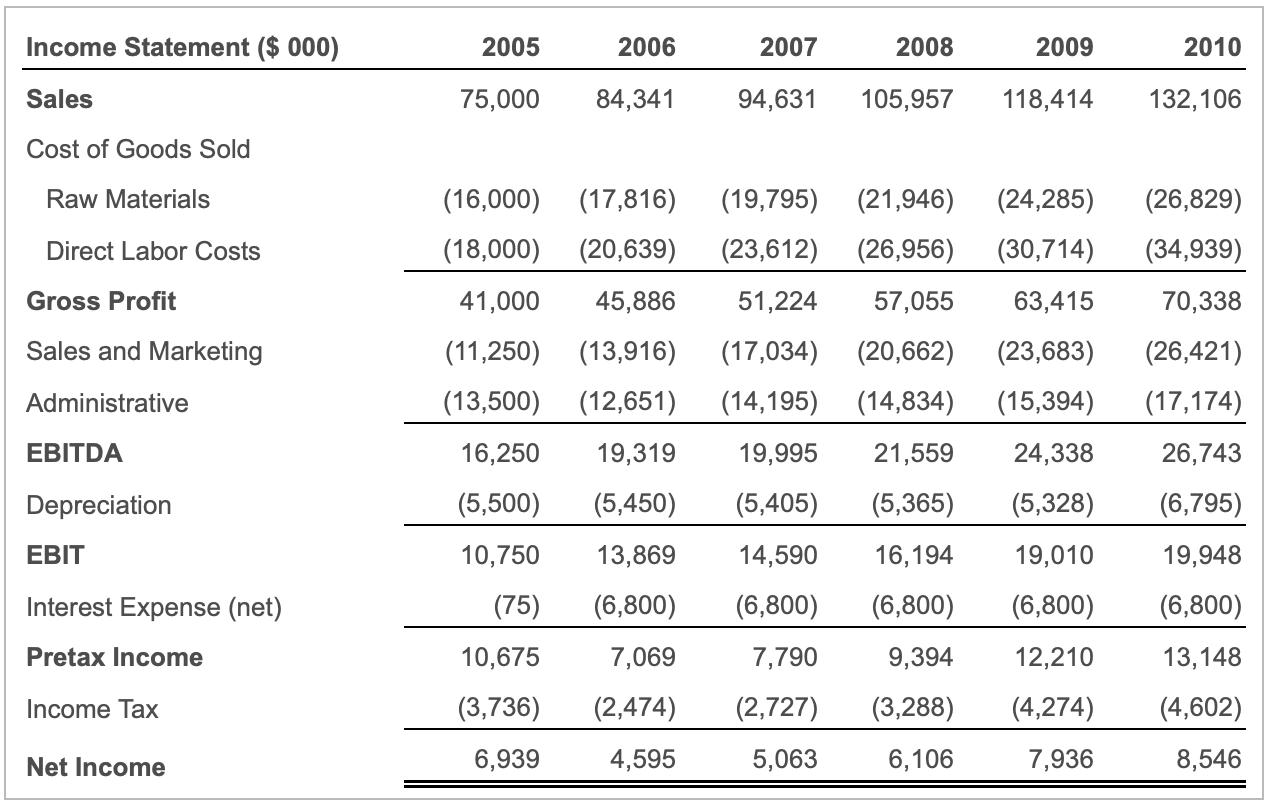
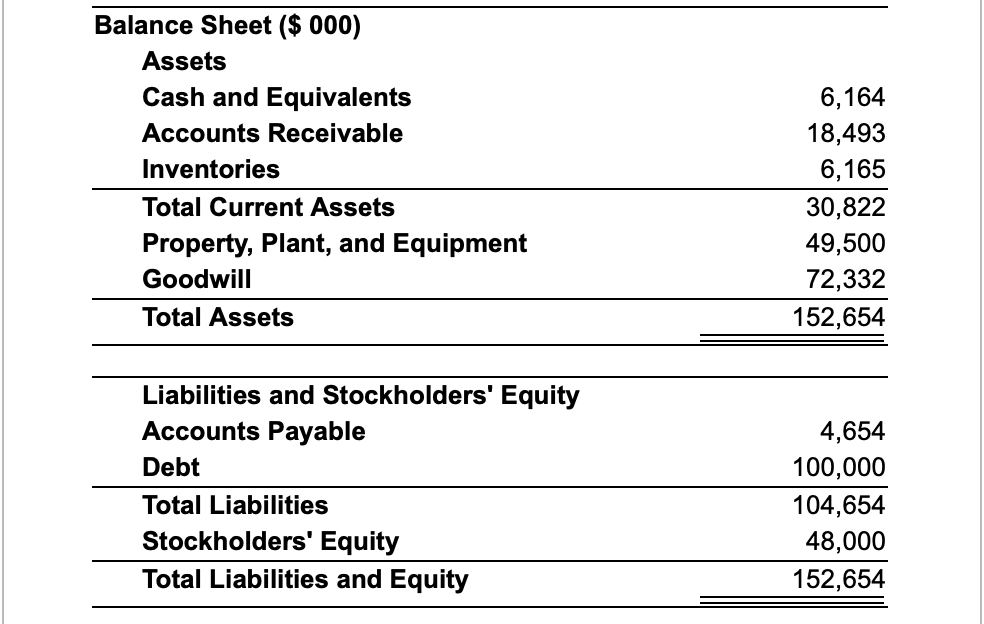
Under the assumptions that Ideko's market share will increase by 0.50 percent per year (implying that the investment, financing, and depreciation will be adjusted accordingly) and assuming that the following forecasts do not transpire (so the numbers in the table remain at their 2005 levels through 2010), calculate Ideko's working capital requirements though 2010 (that is, reproduce Table 19.9 under the new assumptions). Ideko's pro-forma income statements for 2005-2010 are shown here, while its balance sheet for 2005 is shown here Calculate Ideko's working capital requirements through 2010 below: (Round to the nearest $ 000.) Working Capital ($ 000) 2005 2006 2007 2008 2009 2010 Assets Accounts Receivable Raw Materials Finished Goods Minimum Cash Balance Total Current Assets Liabilities Wages Payable Other Accounts Payable Total Current Liabilities Net Working Capital Increase in Net Working Capital 2005 Days 90 45 45 30 > 2005 Days 90 45 Working Capital Days Assets Based on: Accounts Receivable Sales Revenue Raw Materials Raw Materials Costs Finished Goods Raw Materials + Labor Costs Minimum Cash Balance Sales Revenue Liabilities Wages Payable Direct Labor + Admin Costs Other Accounts Payable Raw Materials + Sales and Marketing 45 30 15 15 45 45 TABLE 19.9 SPREADSHEET Ideko's Net Working Capital Forecast 2005 2006 2007 2008 2009 2010 Year Working Capital ($ 000) Assets 1 Accounts Receivable 2 Raw Materials 3 Finished Goods 4 Minimum Cash Balance 5 Total Current Assets Liabilities 6 Wages Payable 7 Other Accounts Payable 8 Total Current Liabilities Net Working Capital 9 Net Working Capital (5-8) 10 Increase in Net Working Capital 18,493 14,525 1,973 1,534 4,192 4,967 6,164 7,262 30,822 28,288 16,970 1,775 5,838 8,485 33,067 19,689 22,709 26,059 2,039 2,329 2,646 6,815 7,911 9,138 9,845 11,355 13,030 38,388 44,304 50,872 1,294 3,360 4,654 1,433 4,099 5,532 1,695 4,953 6,648 1,941 5,938 7,879 2.211 2,570 6,900 7,878 9,110 10,448 26,168 22.756 (3,412) 26,419 3.663 30,509 4,089 35,194 40,425 4,685 5,231 Income Statement ($ 000) 2005 2006 2007 2008 2009 2010 Sales 75,000 84,341 94,631 105,957 118,414 132,106 Cost of Goods Sold Raw Materials (21,946) (16,000) (18,000) (17,816) (20,639) (19,795) (23,612) (24,285) (30,714) (26,829) (34,939) Direct Labor Costs (26,956) Gross Profit 51,224 57,055 63,415 70,338 Sales and Marketing 41,000 45,886 (11,250) (13,916) (13,500) (12,651) (17,034) (14,195) (20,662) (14,834) (23,683) (15,394) (26,421) (17,174) Administrative EBITDA 16,250 19,319 19,995 21,559 24,338 26,743 Depreciation (5,500) (5,450) (5,405) (5,365) (5,328) (6,795) EBIT 10,750 13,869 14,590 19,010 16,194 (6,800) 19,948 (6,800) Interest Expense (net) (75) (6,800) (6,800) (6,800) Pretax Income 10,675 7,069 7,790 9,394 12,210 13,148 Income Tax (3,736) (2,474) (2,727) (3,288) (4,274) (4,602) Net Income 6,939 4,595 5,063 6,106 7,936 8,546 Balance Sheet ($ 000) Assets Cash and Equivalents Accounts Receivable Inventories Total Current Assets Property, Plant, and Equipment Goodwill 6,164 18,493 6,165 30,822 49,500 72,332 152,654 Total Assets Liabilities and Stockholders' Equity Accounts Payable Debt Total Liabilities Stockholders' Equity Total Liabilities and Equity 4,654 100,000 104,654 48,000 152,654 Under the assumptions that Ideko's market share will increase by 0.50 percent per year (implying that the investment, financing, and depreciation will be adjusted accordingly) and assuming that the following forecasts do not transpire (so the numbers in the table remain at their 2005 levels through 2010), calculate Ideko's working capital requirements though 2010 (that is, reproduce Table 19.9 under the new assumptions). Ideko's pro-forma income statements for 2005-2010 are shown here, while its balance sheet for 2005 is shown here Calculate Ideko's working capital requirements through 2010 below: (Round to the nearest $ 000.) Working Capital ($ 000) 2005 2006 2007 2008 2009 2010 Assets Accounts Receivable Raw Materials Finished Goods Minimum Cash Balance Total Current Assets Liabilities Wages Payable Other Accounts Payable Total Current Liabilities Net Working Capital Increase in Net Working Capital 2005 Days 90 45 45 30 > 2005 Days 90 45 Working Capital Days Assets Based on: Accounts Receivable Sales Revenue Raw Materials Raw Materials Costs Finished Goods Raw Materials + Labor Costs Minimum Cash Balance Sales Revenue Liabilities Wages Payable Direct Labor + Admin Costs Other Accounts Payable Raw Materials + Sales and Marketing 45 30 15 15 45 45 TABLE 19.9 SPREADSHEET Ideko's Net Working Capital Forecast 2005 2006 2007 2008 2009 2010 Year Working Capital ($ 000) Assets 1 Accounts Receivable 2 Raw Materials 3 Finished Goods 4 Minimum Cash Balance 5 Total Current Assets Liabilities 6 Wages Payable 7 Other Accounts Payable 8 Total Current Liabilities Net Working Capital 9 Net Working Capital (5-8) 10 Increase in Net Working Capital 18,493 14,525 1,973 1,534 4,192 4,967 6,164 7,262 30,822 28,288 16,970 1,775 5,838 8,485 33,067 19,689 22,709 26,059 2,039 2,329 2,646 6,815 7,911 9,138 9,845 11,355 13,030 38,388 44,304 50,872 1,294 3,360 4,654 1,433 4,099 5,532 1,695 4,953 6,648 1,941 5,938 7,879 2.211 2,570 6,900 7,878 9,110 10,448 26,168 22.756 (3,412) 26,419 3.663 30,509 4,089 35,194 40,425 4,685 5,231 Income Statement ($ 000) 2005 2006 2007 2008 2009 2010 Sales 75,000 84,341 94,631 105,957 118,414 132,106 Cost of Goods Sold Raw Materials (21,946) (16,000) (18,000) (17,816) (20,639) (19,795) (23,612) (24,285) (30,714) (26,829) (34,939) Direct Labor Costs (26,956) Gross Profit 51,224 57,055 63,415 70,338 Sales and Marketing 41,000 45,886 (11,250) (13,916) (13,500) (12,651) (17,034) (14,195) (20,662) (14,834) (23,683) (15,394) (26,421) (17,174) Administrative EBITDA 16,250 19,319 19,995 21,559 24,338 26,743 Depreciation (5,500) (5,450) (5,405) (5,365) (5,328) (6,795) EBIT 10,750 13,869 14,590 19,010 16,194 (6,800) 19,948 (6,800) Interest Expense (net) (75) (6,800) (6,800) (6,800) Pretax Income 10,675 7,069 7,790 9,394 12,210 13,148 Income Tax (3,736) (2,474) (2,727) (3,288) (4,274) (4,602) Net Income 6,939 4,595 5,063 6,106 7,936 8,546 Balance Sheet ($ 000) Assets Cash and Equivalents Accounts Receivable Inventories Total Current Assets Property, Plant, and Equipment Goodwill 6,164 18,493 6,165 30,822 49,500 72,332 152,654 Total Assets Liabilities and Stockholders' Equity Accounts Payable Debt Total Liabilities Stockholders' Equity Total Liabilities and Equity 4,654 100,000 104,654 48,000 152,654
Step by Step Solution
There are 3 Steps involved in it

Get step-by-step solutions from verified subject matter experts