

Question: Under the Base Case, what is the Terminal Value based on the average of: 1) The terminal value based on a perpetual growth rate, and;
 Under the Base Case, what is the Terminal Value based on the average of: 1) The terminal value based on a perpetual growth rate, and; 2) The terminal value based on the EBITDA exit multiple assumption outlined on the "Control Panel" tab. Choose the right answer:
$127,084
$125,859
$129,245
$124,923
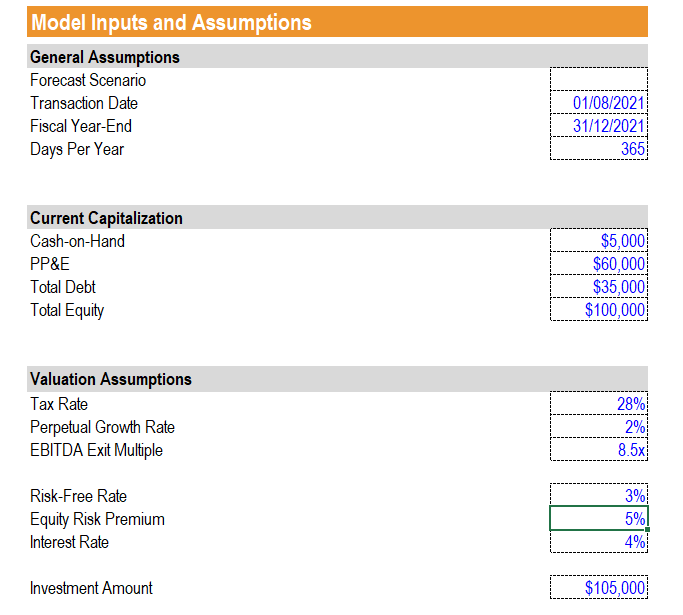
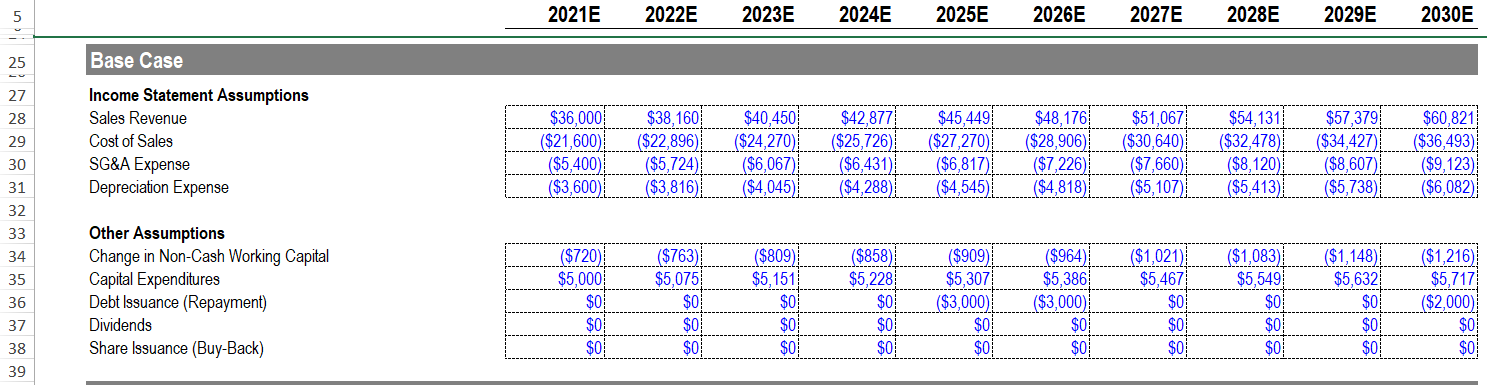
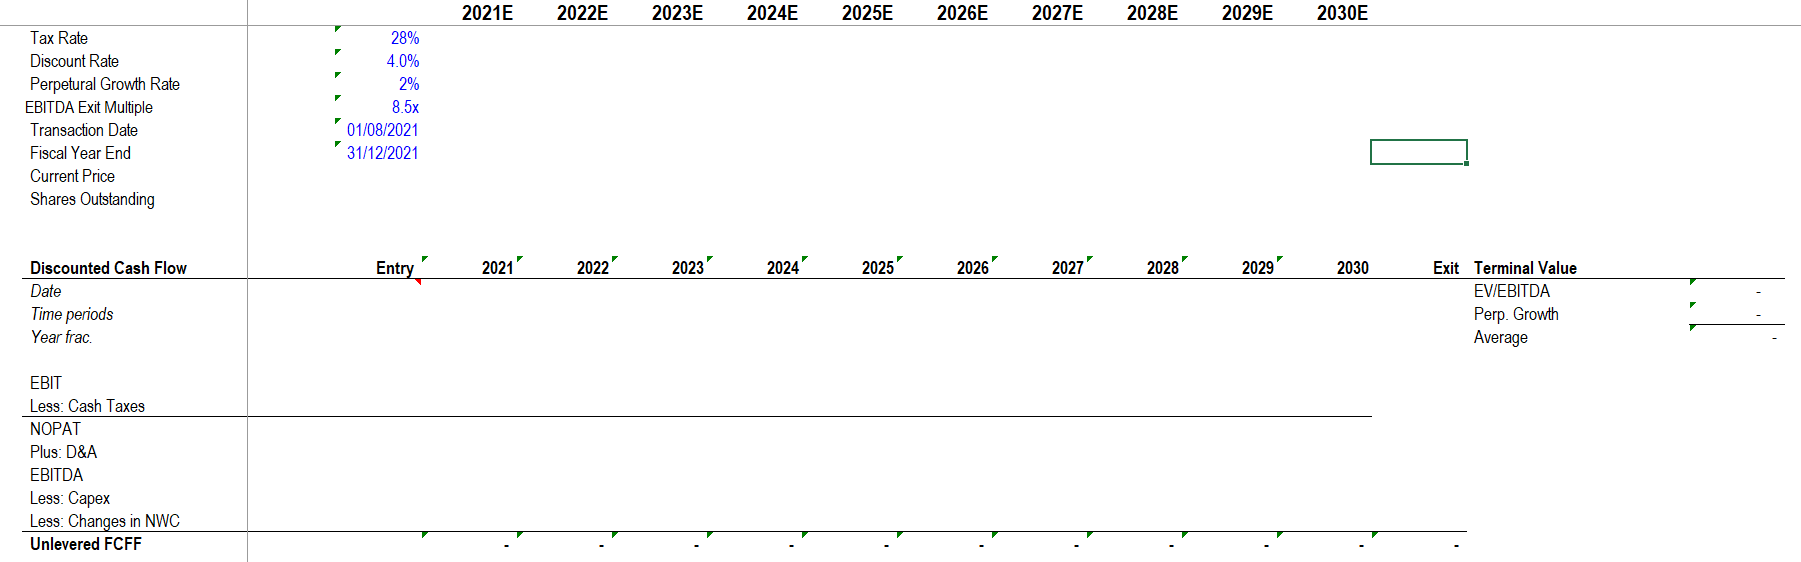
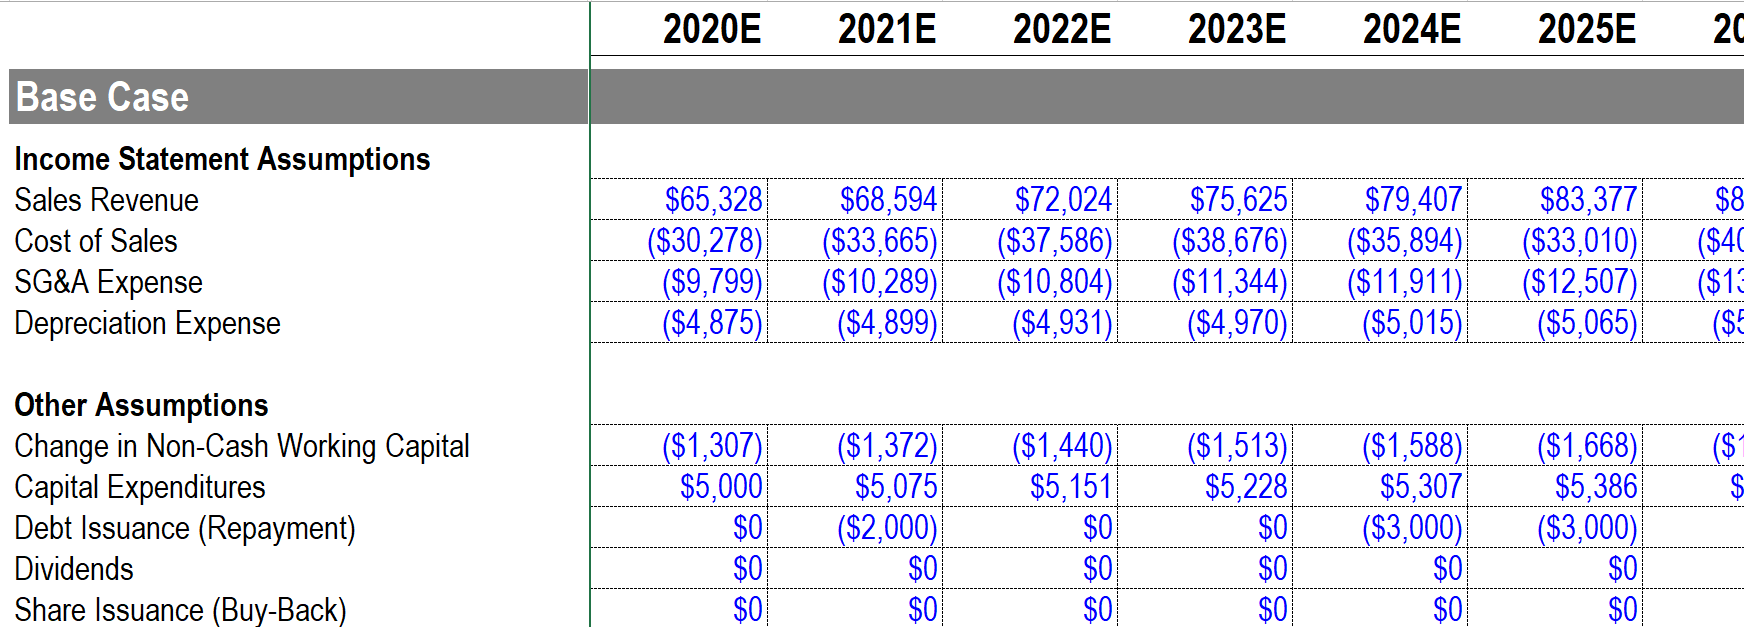
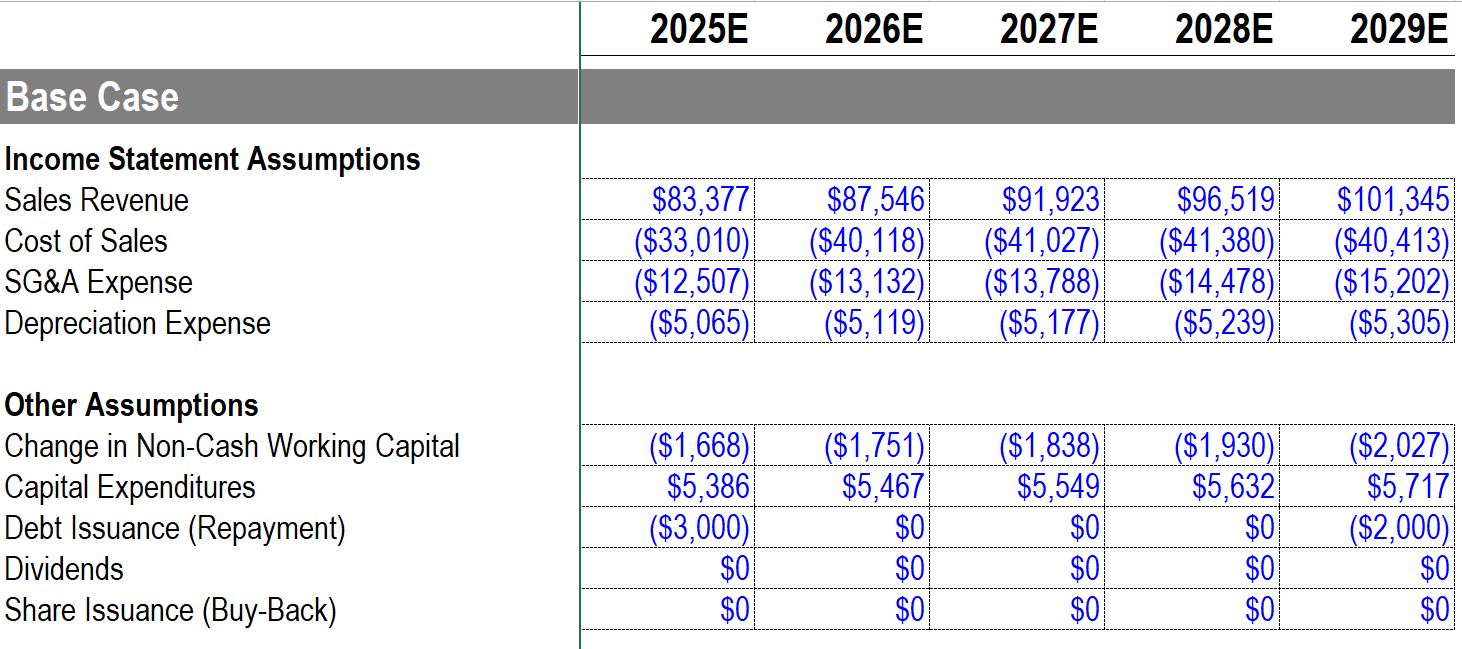
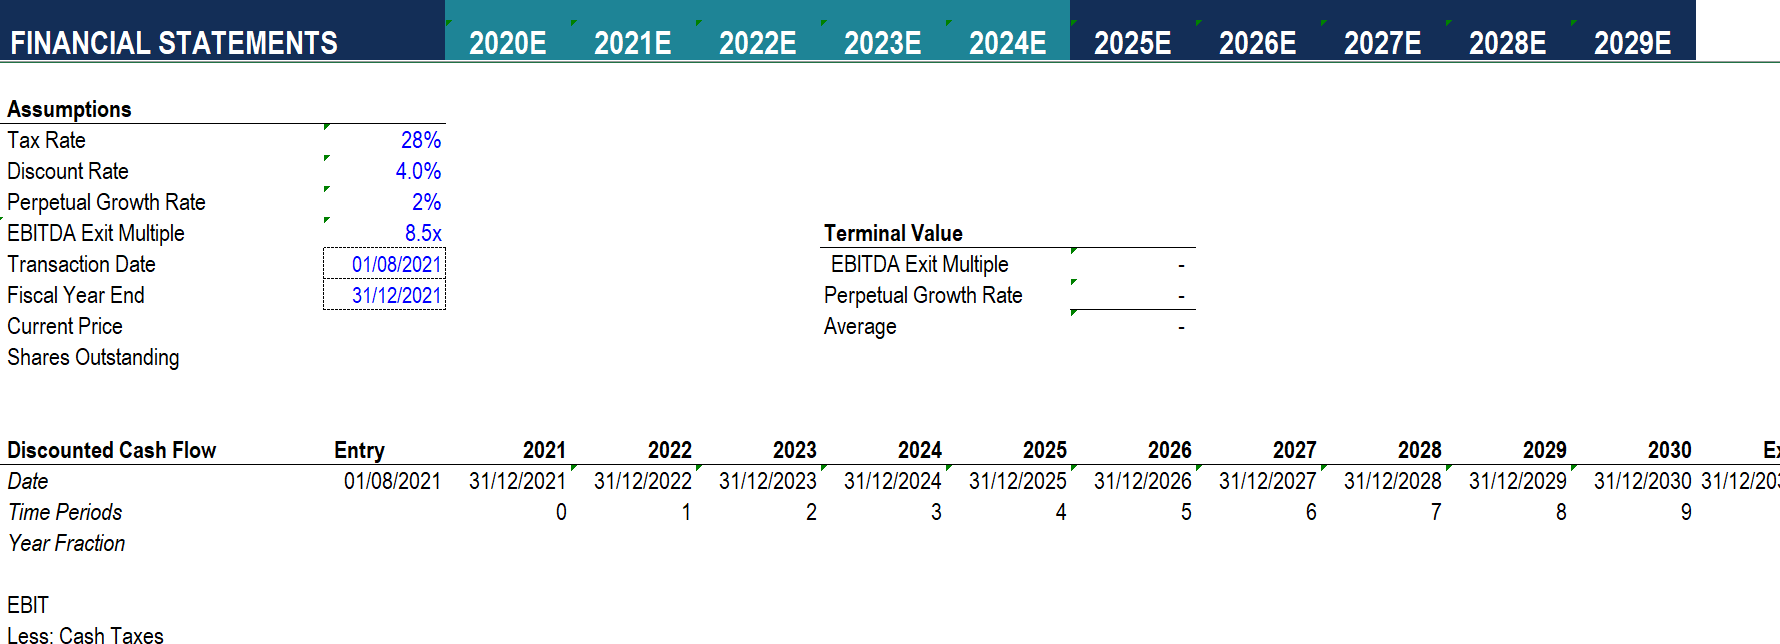
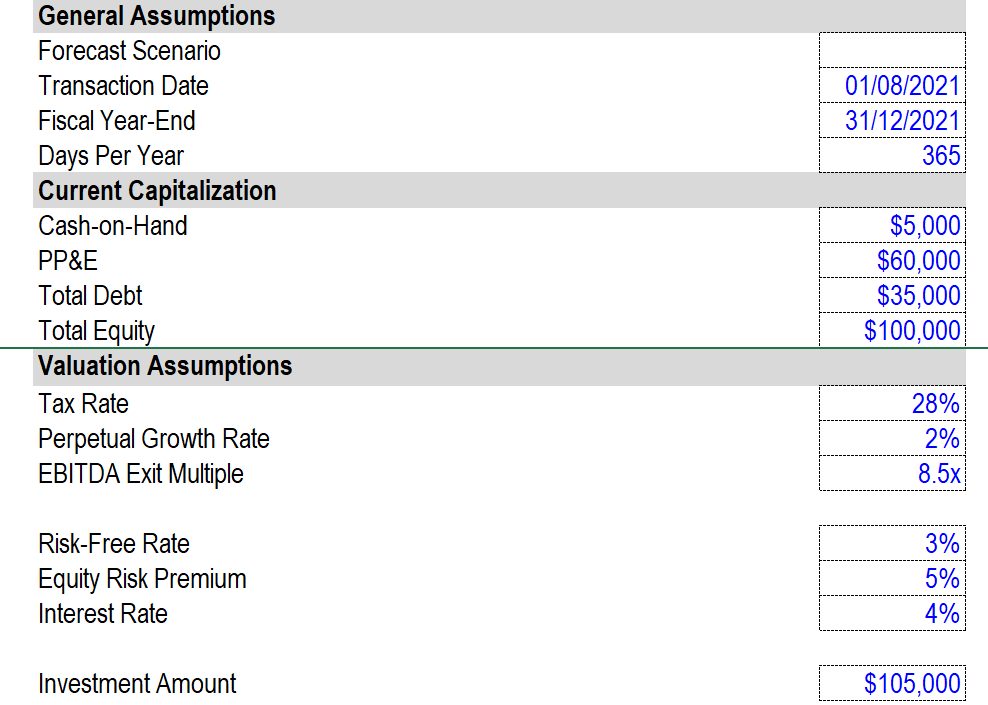
2020E 2021E 2022E 2023E 2024E 2025E 20 Base Case Income Statement Assumptions Sales Revenue Cost of Sales SG&A Expense Depreciation Expense $65,328 ($30,278) ($9,799) ($4,875) $68,594 ($33,665) ($10,289) ($4,899) $72,024 ($37,586) ($10,804) ($4,931) $75,625 ($38,676) ($11,344) ($4,970) $79,407 ($35,894) ($11,911) ($5,015) $83,377 ($33,010) ($12,507) ($5,065) $8 ($40 ($12 ($5 ($1 Other Assumptions Change in Non-Cash Working Capital Capital Expenditures Debt Issuance (Repayment) Dividends Share Issuance (Buy-Back) ($1,307) $5,000 $0 $0 $0 ($1,372) $5,075 ($2,000) $0 $0 ($1,440) $5,151 $0 $0 $0 ($1,513) $5,228 $0 $0 $0 ($1,588) $5,307 ($3,000) $0 $0 ($1,668) $5,386 ($3,000) $0 $0 2025E 2026E 2027E 2028E 2029E Base Case Income Statement Assumptions Sales Revenue Cost of Sales SG&A Expense Depreciation Expense $83,377 ($33,010) ($12,507) ($5,065) $87,546 ($40,118) ($13,132) ($5,119) $91,923 ($41,027) ($13,788) ($5,177) $96,519 ($41,380) ($14,478) ($5,239) $101,345 ($40,413) ($15,202) ($5,305) Other Assumptions Change in Non-Cash Working Capital Capital Expenditures Debt Issuance (Repayment) Dividends Share Issuance (Buy-Back) ($1,668) $5,386 ($3,000) $0 $0 ($1,751) $5,467 $0 $0 $0 ($1,838) $5,549 $0 $0 $0 ($1,930) $5,632 $0 $0 $0 ($2,027) $5,717 ($2,000) $0 $0 FINANCIAL STATEMENTS 2020E 2021E 2022E 2023E 2024E 2025E 2026E 2027E 2028E 2029E Assumptions Tax Rate Discount Rate Perpetual Growth Rate EBITDA Exit Multiple Transaction Date Fiscal Year End Current Price Shares Outstanding 28% 4.0% 2% 8.5x 01/08/2021 31/12/2021 Terminal Value EBITDA Exit Multiple Perpetual Growth Rate Average 2022 Entry 01/08/2021 Discounted Cash Flow Date Time Periods Year Fraction 2021 31/12/2021 0 31/12/2022 1 2023 31/12/2023 2 2024 2025 31/12/2024 31/12/2025 3 4 2026 2027 31/12/2026 31/12/2027 5 6 2028 31/12/2028 7 2029 31/12/2029 8 2030 E 31/12/2030 31/12/20 9 EBIT Less: Cash Taxes 01/08/2021 31/12/2021 365 General Assumptions Forecast Scenario Transaction Date Fiscal Year-End Days Per Year Current Capitalization Cash-on-Hand PP&E Total Debt Total Equity Valuation Assumptions Tax Rate Perpetual Growth Rate EBITDA Exit Multiple $5,000 $60,000 $35,000 $100,000 28% 2% 8.5x Risk-Free Rate Equity Risk Premium Interest Rate 3% 5% 4% Investment Amount $105,000 Model Inputs and Assumptions General Assumptions Forecast Scenario Transaction Date Fiscal Year-End Days Per Year 01/08/2021 31/12/2021 365 Current Capitalization Cash-on-Hand PP&E Total Debt $5,000 $60,000 $35,000 $100,000 Total Equity Valuation Assumptions Tax Rate Perpetual Growth Rate EBITDA Exit Multiple 28% 2% 8.5x Risk-Free Rate Equity Risk Premium Interest Rate 3% 5% 4% Investment Amount $105,000 2021E 2022E 2023E 2024E 2025E 2026E 2027E 2028E 2029E 2030E 25 Base Case Income Statement Assumptions Sales Revenue Cost of Sales SG&A Expense Depreciation Expense $36.000 ($21,600) ($5,400) ($3,600) $38,160 ($22,896) ($5,724) ($3,816) $40.450 ($24,270) ($6,067) ($4,045) $42.877 ($25,726) ($6,431) ($4,288) $45,449 ($27,270) ($6,817) ($4,545) $48,176 ($28,906) ($7,226) ($4,818) $51,067 ($30,640) ($7,660) ($5,107) $54,131 ($32,478) ($8,120 ($5,413) $57,379 ($34,427) ($8,607) ($5,738) $60,821 ($36,493) ($9,123) ($6,082) 27 28 29 30 31 32 33 34 35 36 37 38 39 Other Assumptions Change in Non-Cash Working Capital Capital Expenditures Debt Issuance (Repayment) Dividends Share Issuance (Buy-Back) ($720) $5,000 $0 $0 $0. ($763) $5,075 $0 $0 $0 ($809) $5,151 $0 $0 $0 ($858) $5,228 $0 $0 $0 ($909) $5,307 ($3,000) $0 $0 ($964) $5,386 ($3,000) $0 ($1,021) $5,467 SO $0 $0 ($1,083) $5,549 $0 $0 $0 ($1,148) $5,632 $0 $0 $0 ($1,216) $5,717 ($2,000) SO $0 $0 Income Statement Sales Revenue Cost of Sales Gross Profit $0 $0 $0 $0 $0 $0 $0 $0' $0 $0 $0 $0 $0 $0' $0 $0 $0' $0 $0 $0' $0 $0' $0 $0 $0' $0 $0 $0 $0 $0 $0" $0 $0" $0 $0 $0' $0 $0 $0' $0 $0" $0 $0 $0 $0' $0 $0' $0' $0 $0 SG&A Expense Depreciation Expense Interest Expense Income Before Income Taxes Income Taxes Net Income $0 $0 $0 $0 $0 $0 $0 $0 $0 $0 $0 $0 $0 $0 $0 $0 $0 $0 $0 $0 2021E 2022E 2023E 2024E 2025E 2026E 2027E 2028E 2029E 2030E Balance Sheet Items PP&E Schedule PP&E, Opening Balance Capital Expenditures Depreciation Expense PP&E, Ending Balance $0 $0 $0 $0 $0 $0 $0 $0 $0 $0 Debt Schedule Total Debt, Opening Balance Issuance (Repayment) Total Debt, Ending Balance Interest Expense $0 $0 $0 $0 50" $0 $0 $0 $0 $0 Equity Schedule Total Equity, Opening Balance Net Income Dividends Share Issuance (Buy-Back) Total Equity, Ending Balance $0 $0 $0 SO $0 $0 $0 $0 $0 $0 2021E 2022E 2023E 2024E 2025E 2026E 2027E 2028E 2029E 2030E Tax Rate Discount Rate Perpetural Growth Rate EBITDA Exit Multiple Transaction Date Fiscal Year End Current Price Shares Outstanding 28% 4.0% 2% 8.5x 01/08/2021 31/12/2021 Entry 2021) 2022 2023 2024' 2025' 2026 2027' 2028 2029 2030 Discounted Cash Flow Date Time periods Year frac Exit Terminal Value EV/EBITDA Perp. Growth Average EBIT Less: Cash Taxes NOPAT Plus: D&A EBITDA Less: Capex Less: Changes in NWC Unlevered FCFF
Step by Step Solution
There are 3 Steps involved in it

Get step-by-step solutions from verified subject matter experts