

Question: Undo Clipboard Font MATH 1308/1309 Part 2: Inferential Statistics Methods Identify the two variables for which inferences of population parameters are being done. For
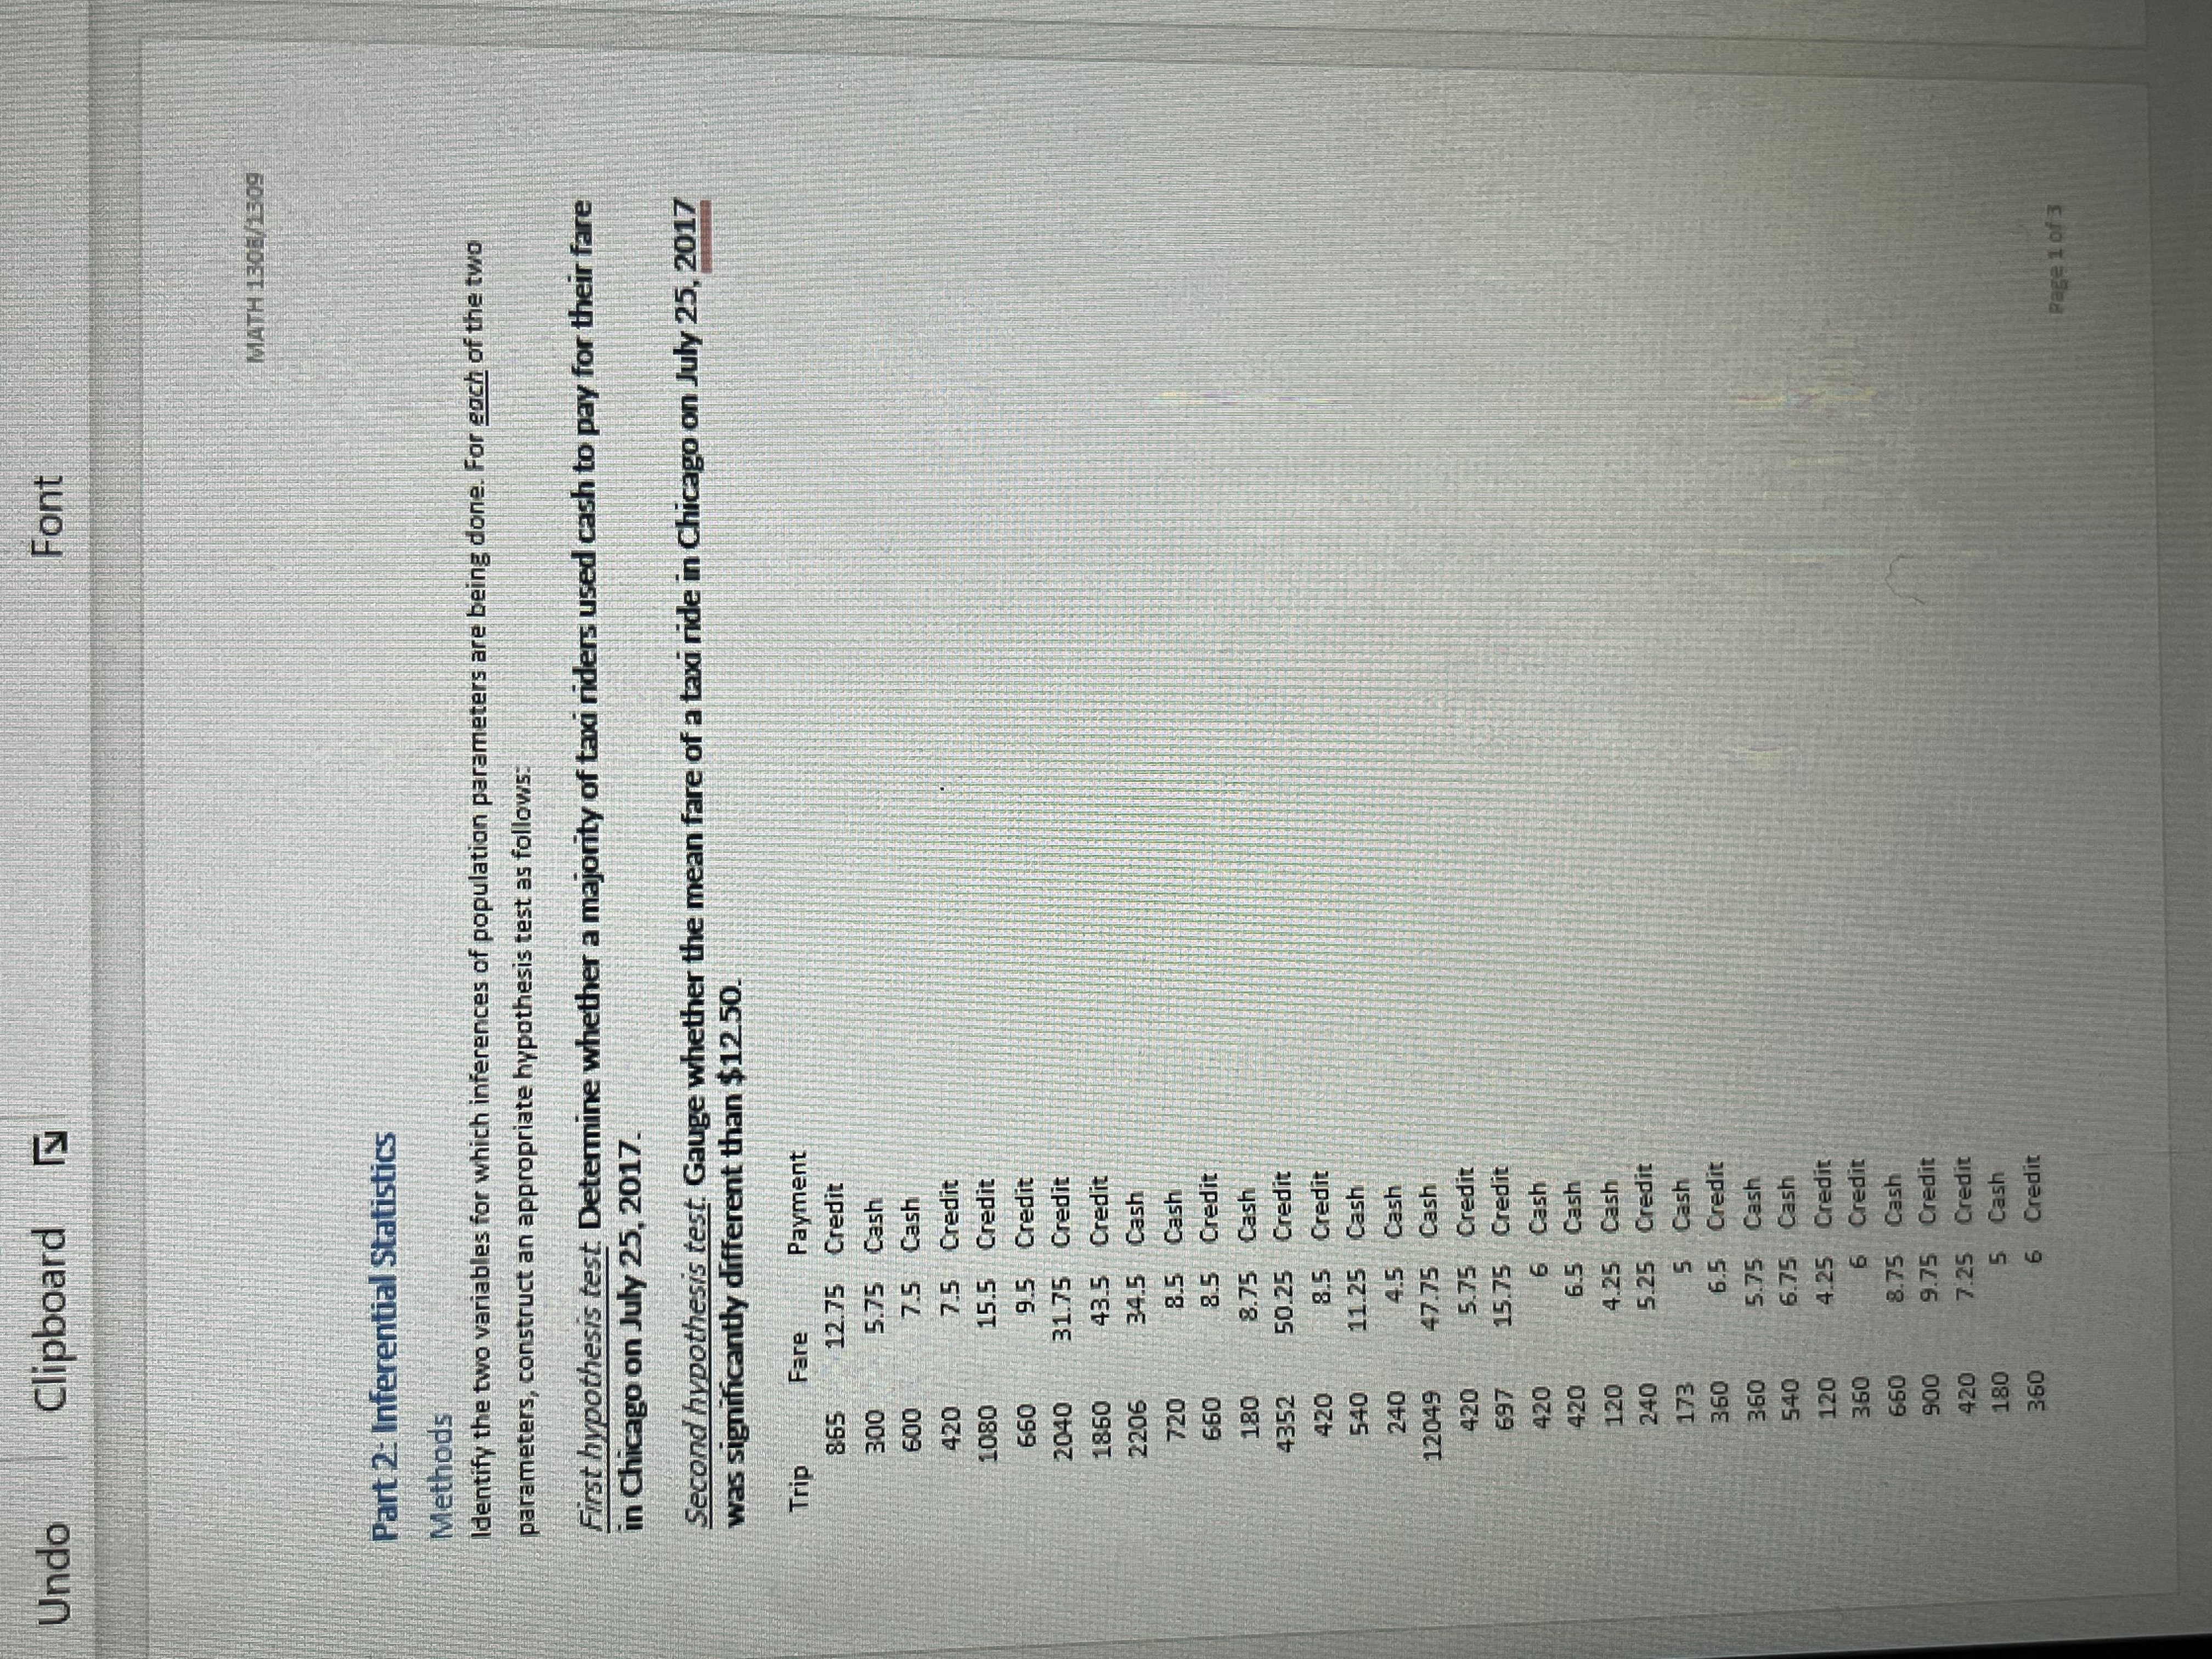

Undo Clipboard Font MATH 1308/1309 Part 2: Inferential Statistics Methods Identify the two variables for which inferences of population parameters are being done. For each of the two parameters, construct an appropriate hypothesis test as follows: First hypothesis test. Determine whether a majority of taxi riders used cash to pay for their fare in Chicago on July 25, 2017. Second hypothesis test. Gauge whether the mean fare of a taxi ride in Chicago on July 25, 2017 was significantly different than $12.50. Trip Fare Payment 865 12.75 Credit 300 5.75 Cash 600 7.5 Cash 420 7.5 Credit 1080 15.5 Credit 660 9.5 Credit 2040 31.75 Credit 1860 43.5 Credit 2206 34.5 Cash 720 8.5 Cash 660 8.5 Credit 180 8.75 Cash 4352 50.25 Credit 420 8.5 Credit 540 11.25 Cash 240 4.5 Cash 12049 47.75 Cash 420 5.75 Credit 697 15.75 Credit 420 6 Cash 420 6.5 Cash 120 4.25 Cash 240 5.25 Credit 173 5 Cash 360 6.5 Credit 360 5.75 Cash 540 6.75 Cash 120 4.25 Credit 360 6 Credit 660 8.75 Cash 900 9.75 Credit 420 7.25 Credit 180 5 Cash 360 6 Credit Page 1 of 3 ble earch MATH 1308/1309 300 6 Credit 982 11.25 Cash 3960 47 Credit 360 6 Credit 300 5.75 Cash 300 5.5 Credit 480 7 Credit 600 8.5 Credit 480 9 Credit 720 8.5 Credit 890 10.5 Credit 569 9.5 Cash 360 6.5 Cash 480 7.75 Cash 188 4.75 Credit 300 5.5 Credit 180 5 Cash 480 8.75 Credit 480 11.75 Cash 351 5.5 Credit 1260 12 Credit 1980 35 Credit 745 9.5 Credit 300 6 Credit 1080 13.5 Credit 180 5.25 Cash Hypotheses: State clearly the null and alternative hypotheses and the level of significance. Assumptions: Identify and justify the type of hypothesis test being used. Include assumptions made about the population and the sampling distribution of the sample statistic. Findings Complete the hypothesis test of each parameter. Label each step as outlined below. Interpretations should be made within the context of the hypothesized parameter value and the sample data using complete sentences. Insert/embed tables and graphs from StatCrunch or other software if needed. Do not paste screenshots. Test statistic: State the calculated value and interpret its meaning. P-value: State the calculated value and interpret its meaning. Decision: Use the P-value approach to make a correct test decision with respect to the null hypothesis. Conclusion: Make a conclusive statement with respect to the alternative hypothesis in its context. Extra Credit (10 points); Justify whether a linear correlation exists between the two quantitative variables of the dataset. If so, provide the equation for the best-fit line and interpret the slope in proper context. Conclusion Briefly address the overall meaningfulness of the statistical inquiry using complete sentences. Focus on inferences about the identified population of interest and how the inquiry could be used to benefit that community LO Page 2 of 3 DELL 200m
Step by Step Solution
There are 3 Steps involved in it

Get step-by-step solutions from verified subject matter experts