

Question: Unit 2 Financial Statement Analysis Unit 2: Practical Framework Tools and techniques of Financial Statement Analysis There are three commonly used tools and techniques for
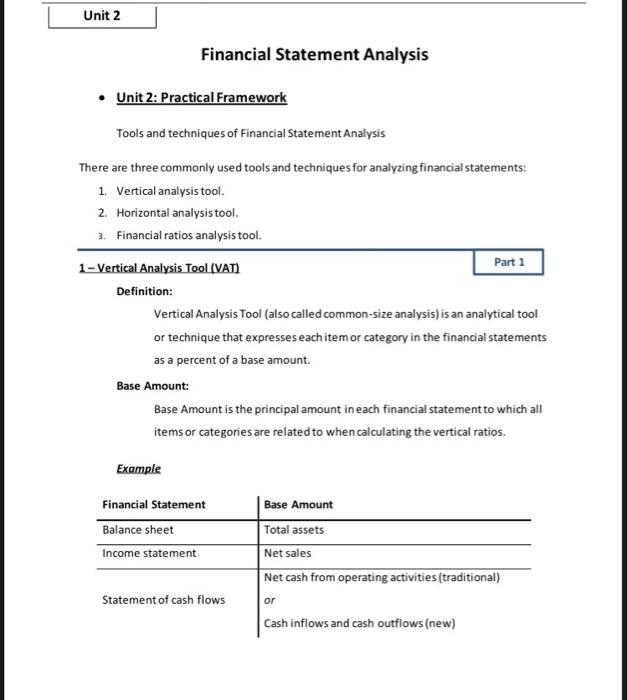
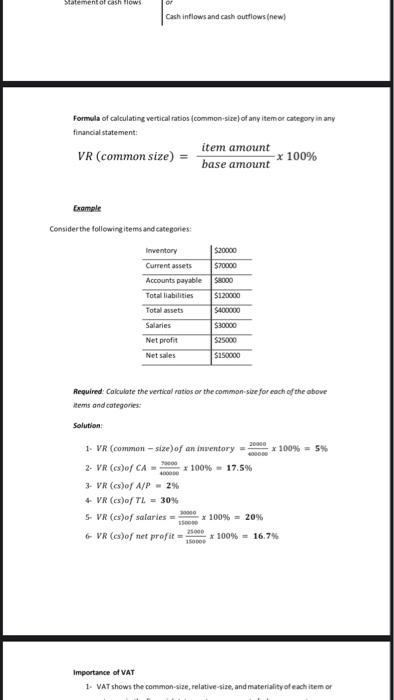
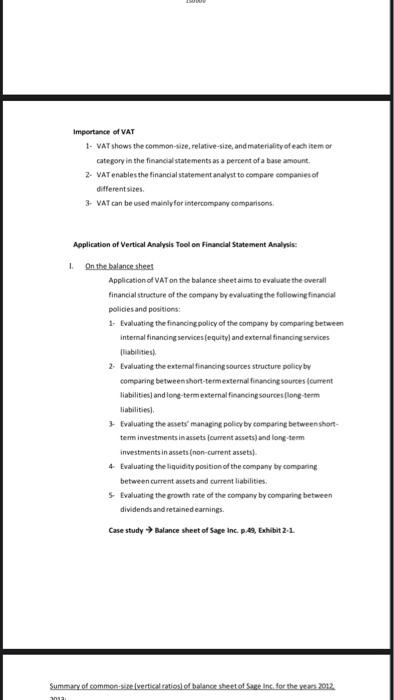
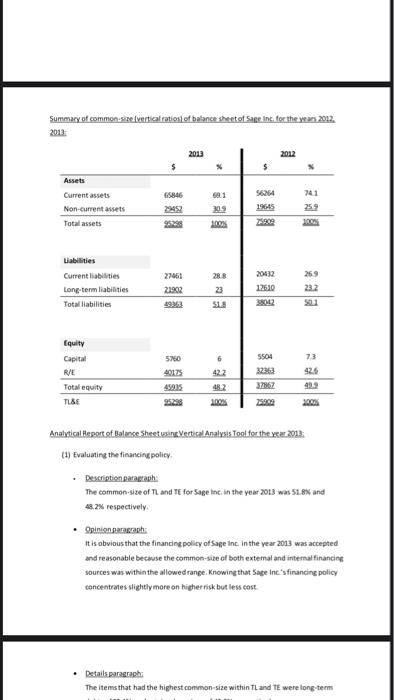
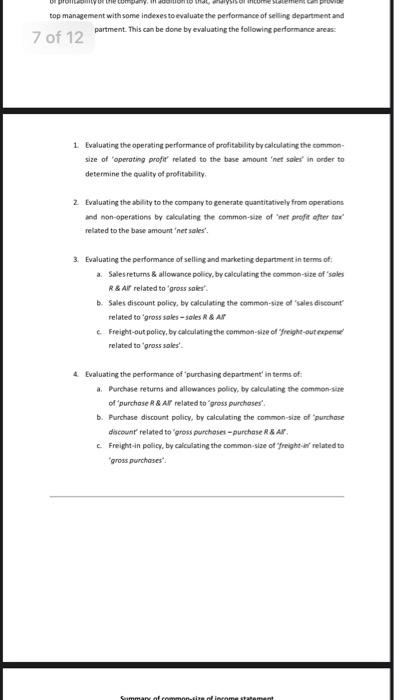
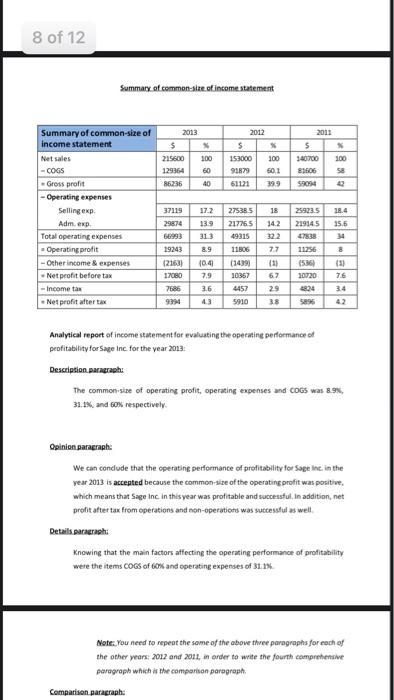
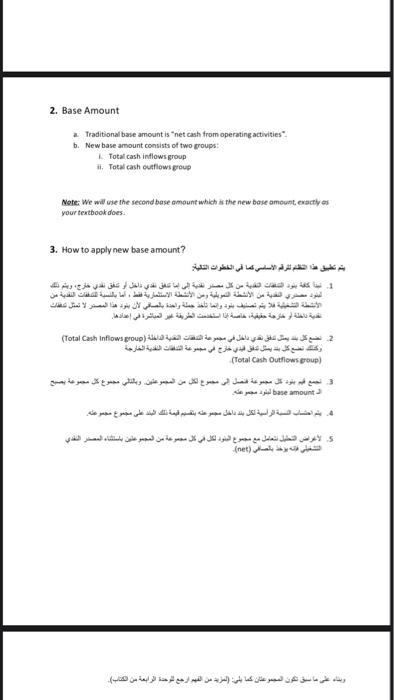
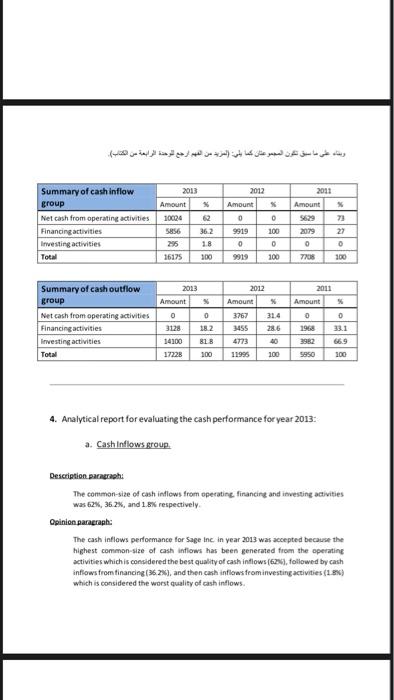
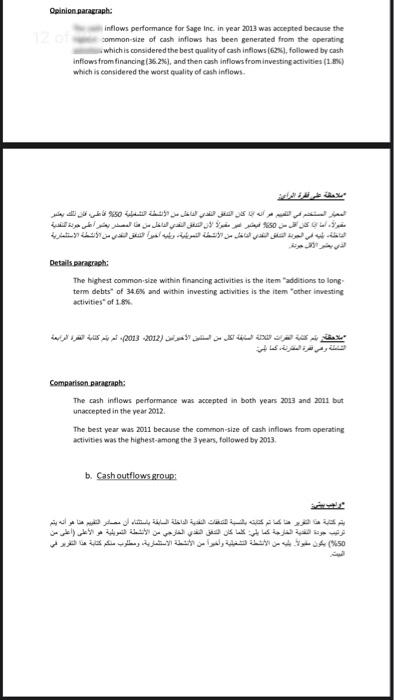
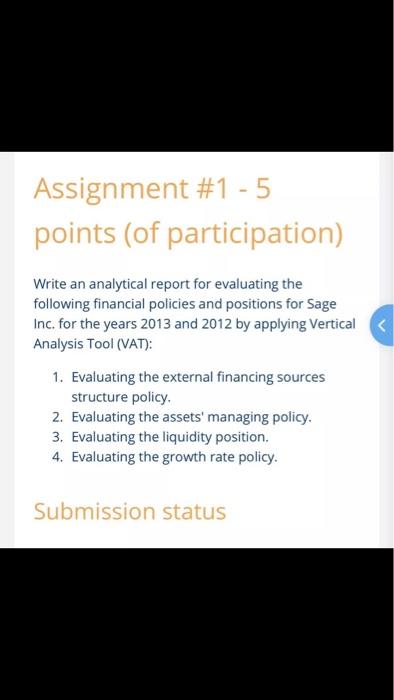
Unit 2 Financial Statement Analysis Unit 2: Practical Framework Tools and techniques of Financial Statement Analysis There are three commonly used tools and techniques for analyzing financial statements: 1. Vertical analysis tool. 2. Horizontal analysis tool. 3. Financial ratios analysis tool. 1 - Vertical Analysis Tool (VAT) Part 1 Definition: Vertical Analysis Tool (also called common-size analysis) is an analytical tool or technique that expresses each item or category in the financial statements as a percent of a base amount Base Amount: Base Amount is the principal amount in each financial statement to which all items or categories are related to when calculating the vertical ratios. Example Financial Statement Balance sheet Income statement Base Amount Total assets Net sales Net cash from operating activities (traditional) Statement of cash flows or Cash inflows and cash outflows (new) Statement of cash flows Cash inflows and cash outflows (new) Formula of calculating vertical ratios (common size) of any item or category in any financial statement: VR (common size) item amount base amount x 100% Example Consider the following items and categories: Inventory Current assets Accounts payable Total liabilities Total assets Salaries Net profit Net sales $20000 $70000 $8000 $120000 SAOOOOO S30000 S25000 $150000 2000 Required. Calculate the vertical ratios or the common size for each of the above Items and categories: Solution 1- VR (common-six) of an inventory * 100% - 5% 2. VR (es)of CA *100% - 17.5% 3- VR (s)of A/P - 2% + VR (X)ofl. = 30% S VR (s)of salaries - 2600 * 100% = 20% 25.000 VR (es)of net profit * 100% = 16,7% Importance of VAT 1. VAT shows the common size, relative-size, and materiality of each item or Importance of VAT 1. VAT shows the common-size relative-size and materiality of each item or Category in the financial statements as a percent of a base amount 2. VAT enables the financial statement analyst to compare companies of different sizes 3- VAT can be used mainly for intercompany comparisons 1 Application of Vertical Analysis tool on Financial Statement Analysis: On the balance sheet Application of VAT on the balance sheet aims to evaluate the overall financial structure of the company by evaluating the following financial policies and positions: 1. Evaluating the financing policy of the company by comparing between internal financing services (equity and external financing services abilities 2. Evaluating the extemal financing sources structure policy by comparing between short-termexternal financing sources Content liabilities and long-term external financing sources long-term liabilities Evaluating the asset managing policy by comparing between short- term investments in assets current assets and long-term investments in assets (non-current assets) 4 Evaluating the liquidity position of the company by comparing between current assets and current liabilities Evaluating the growth rate of the company by comparing between dividends and retained earnings. Case study Balance sheet of Sage Inc. p.48. Exhibit 2-2 Summary of common size vertical ratios of balance sheet of Sage in for the years 2012 Summary of common site (vertical ration of balance sheet of Sage Inc. for the year 2012. 2013 2012 $ 741 Assets Current assets Non-current assets Total assets 56264 1945 309 100 Liabilities Current liabilities Long-term liabilities Total liabilities 27461 2192 288 23 18 20012 12630 269 23.2 Equity Capital 6 73 5760 40128 R/E Total equity TLSE 5504 32363 37867 49.3 100% 25969 Analytical resort of Balance SheetsingVertical Analysis Tost for the year 2013: (1) Evaluating the financing policy Description parah The common size of TL and TE for Sage Inc. in the year 2013 was 51.8% and 18.2% respectively Opinion paragraph It is obvious that the financing policy of Sage Inc. in the year 2013 was accepted and reasonable because the common-size of both extemal and internal financing sources was within the allowed range. Knowing that Sape Inc's financing policy concentrates slightly more on higher risk but les cost Detailsparagraph The items that had the highest common-size within TL and TE were long-term Note: The policy accepted because of the merchandising nature of Sage which requires CA to be higher than NCA, knowing that this policy is more accepted in the year 2012 (4) Evaluating the liquidity.position 2013 2012 CA 69.1% CL 28.8% Liquidity Ratio = 24.3 7.1% 26.9% = 2.761 Accepted policy Accepted policy Note: Liquidity position is accepted in both years, but it as more accepted in the year 2013 because it is closer to the industry average 21 (5) Evaluating the growth rate 2012 2012 R/E 422 Accepted policy Accepted policy Note: Growth rates accepted in both years because the growth rate as positive, but the year 2012 is slightly more accepted Application of Vertical Analysis Tool on 11 Income statement: Application of VAT on income statement aims mainly to evaluate the operating performance of profitability of the company. In addition to that, analysis of income statement can provide top management with some indexes to evaluate the performance of selling department and purchasing department. This can be done by evaluating the following performance areas 1 Evaluating the operating performance of profitability by calculating the common size of operating profit related to the base amount 'net sales in order to determine the quality of profitability top management with some indexes to evaluate the performance of selling department and 7 of 12 partment. This can be done by evaluating the following performance areas: 1. Evaluating the operating performance of profitability by calculating the common size of operating profet related to the base amount "net sales in order to determine the quality of profitability 2 Evaluating the ability to the company to generate quantitatively from operations and non-operations by calculating the common-size of 'net profit after to related to the base amount 'net sales' 3. Evaluating the performance of selling and marketing department in terms of a Sales returns & allowance policy, by calculating the common size of sales R&Ar related to gross sales" . Sales discount policy, by calculating the common-size of sales discount related to gross soles soles R & AP Freight-out policy, by calculating the common-size of freight-out expense related to gross soles 4 Evaluating the performance of purchasing department in terms of: Purchase returns and allowances policy, by calculating the common se of purchase & Ar related to gross purchases b. Purchase discount policy, by calculating the common-size of purchase discount related to gross purchoses-purchase R&A c. Freight in policy, by calculating the common-size of freight or related to gross purchases! Simman alleres 8 of 12 Summary of common size of income statement 2013 $ X 215600 300 129364 60 86236 40 2012 $ 153000 100 91879 601 61121 2011 5 340700 100 81606 590 43 37119 18 18.4 Summary of common-size of income statement Net sales - COGS Gross profit - Operating expenses Selling exp Adm. exp Total operating expenses - Operating profit - Other income & expenses Net profit before tax -Income tax Net profit after tax 17.2 13.9 313 275385 217765 49315 29874 66993 14.2 15.5 259735 21914.5 4838 11256 34 19243 11506 7.7 8 (2163) 17080 7686 9394 10.4 7.9 3.6 43 (1409) 10367 4457 5910 (1) 67 29 38 (536 30720 1824 (3 7.6 34 596 Analytical report of income statement for evaluating the operating performance of profitability for Sage inc. for the year 2013 Description paragraph The common-site of operating profit, operating expenses and Cogs was 8.9% 31.1% and 60% respectively Opinion paragraph We can conclude that the operating performance of profitability for Sage inc. in the year 2013 is accepted because the common size of the operating profit was positive which means that Sage Inc in this year was profitable and successful. In addition, net profit after tax from operations and non-operations was successful as well Details.pacerahi Knowing that the main factors affecting the operating performance of profitability were the items COGS of 60% and operating expenses of 31.1% Note: You need to repeat the some of the above three paragraphs for each of the other years: 2012 and 2011, in order to write the fourth comprehensive paragraph which is the comportion paragraph Comparison paragraph. 2. Base Amount Traditional base amount is net cash from operating activities b. New base amount consists of two groups: Total cash inflows group Total cash flows group ii, Note: We will use the second base amount which is the new base amount, exactly as your textbook does 3. How to apply new base amount? 1. 2. (Total Cash Inflows proup) (Total Cash Outflows group) . beae bunt (net) : ) : ) 2012 2011 X Amount X 2013 Amount 10024 2 5856 36.2 Summary of cash inflow group Net cash from operating activities Financing activities Investing activities Total Amount 0 9919 0 73 2079 205 18 0 . 0 O 16175 300 9919 100 7708 Summary of cash outflow group Net cash from operating activities Financing activities Investing activities Total 2013 Amount 0 0 3128 182 14100 818 17228 100 2012 Amount 3767 31.4 3455 28.6 2011 Amount % 0 0 1968 33.1 2952 66.9 9950 100 4773 100 4. Analytical report for evaluating the cash performance for year 2013: a Cash Inflows group Description paragraphi The common-size of cash Indlows from operating financing and investing activities was 62%, 36.2%, and 1.8% respectively Opinion paragraph: The cash Intlows performance for Sage Inc in year 2013 was accepted because the highest common size of cash inflows has been generated from the operating activities which is considered the best quality of cash inflows (62%), followed by cash inflows from financing (32%), and then cash inflows from investing activities (1.886) which is considered the worst quality of cash inflows. Opinion paragraph: inflows performance for Sage Inc. in year 2013 was accepted because the common size of cash inflows has been generated from the operating which is considered the best quality of cash inflows(62), followed by cash inflows from financing (36.2%), and then cash inflows from investing activities (1.4) which is considered the worst quality of cash inflows. . . Detailsparagraph: The highest common size within financing activities is the item "additions to long- term debts of 34.6% and within investing activities is the item "other investing activities of 18% , (2012. 2013) Comparison paragraph: The cash inflows performance was accepted in both years 2013 and 2011 but unaccepted in the year 2012 | The best year was 2011 because the common-size of cash inflows from operating activities was the highest among the 3 years, followed by 2013 b. Cash outflows group: : %) Assignment #1 -5 points (of participation) Write an analytical report for evaluating the following financial policies and positions for Sage Inc. for the years 2013 and 2012 by applying Vertical
Step by Step Solution
There are 3 Steps involved in it

Get step-by-step solutions from verified subject matter experts