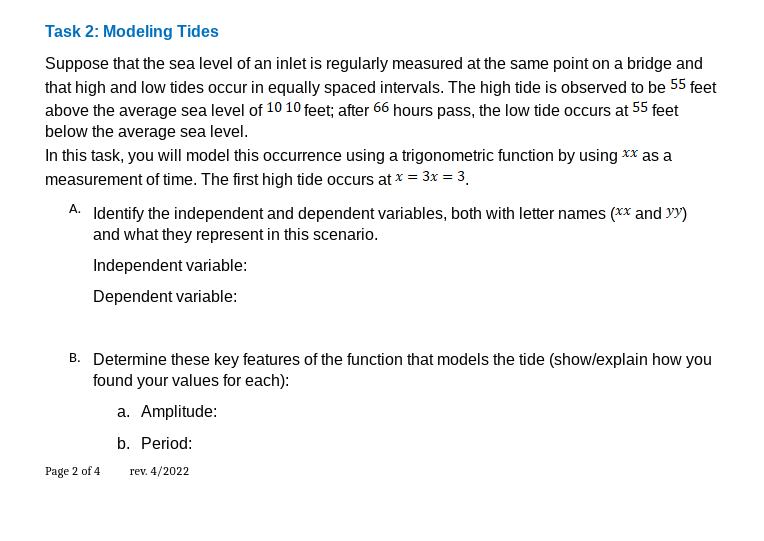
Question: Unit 4 Unit Activity: Trigonometric Functions Introduction You have learned about the features of trigonometric functions as well as how they may be used in

Unit 4 Unit Activity: Trigonometric FunctionsUnit 4 Unit Activity: Trigonometric FunctionsUnit 4 Unit Activity: Trigonometric FunctionsUnit 4 Unit Activity: Trigonometric FunctionsUnit 4 Unit Activity: Trigonometric FunctionsUnit 4 Unit Activity: Trigonometric Functions
Unit 4 Unit Activity: Trigonometric Functions Introduction You have learned about the features of trigonometric functions as well as how they may be used in modeling. In this activity, you will apply these trigonometric skills to two different scenarios. Please enter your responses in the relevant spaces below, then save and upload your completed file to the dropbox within your course for scoring. (Remember to use Windows- friendly file types, such as . doc or .pdf.) Task 1: Modeling Precipitation Suppose that the precipitation in Chicago can be modeled by a trigonometric function. Represent time in months elapsed since the beginning of the year (in other words, in January = 0= 0; February = 1= 1). The average monthly precipitation for the year is 3.53.5 inches, and February is the driest month of the year with 2.252.25 inches of precipitation. A. Identify the independent and dependent variables, both with letter names (xX and vy) and what they represent in this scenario. Independent variable: Dependent variable: B. Find the amplitude and period of the function. Show your work. Amplitude:B. Find the amplitude and period of the function. Show your work. Amplitude: Period: C. Write the trigonometric function that represents the expected precipitation for any given month. Explain why you chose your function type, and show work for any values not already given in part B above. Page 1 of 4 rev. 4/2022ALGEBRA 2 Unit Activity: Trigonometric Functions for Unit 4 of Semester B (v7.0) D. Graph the function you wrote in part C with technology, such as https://www.desmos.com/calculator and insert the graph below. (Be sure to choose appropriate window settings.) E. Predict when the wettest month will be and give the expected precipitation for this month. Show/explain how you arrived at your conclusions.Task 2: Modeling Tides Suppose that the sea level of an inlet is regularly measured at the same point on a bridge and that high and low tides occur in equally spaced intervals. The high tide is observed to be 55 feet above the average sea level of 1010 feet; after 66 hours pass, the low tide occurs at $5 feet below the average sea level. In this task, you will model this occurrence using a trigonometric function by using xx as a measurement of time. The first high tide occurs at * = 3x = 3. A. Identify the independent and dependent variables, both with letter names (xX and y) and what they represent in this scenario. Independent variable: Dependent variable: B. Determine these key features of the function that models the tide (show/explain how you found your values for each): a. Amplitude: b. Period: Page 2 of 4 rev. 4/2022ALGEBRA 2 Unit Activity: Trigonometric Functions for Unit 4 of Semester B (v7.0) C. Frequency: d. Midline: e. Vertical Shift: f. Phase Shift: C. Create a trigonometric function that models the ocean tide. Explain why you chose your function type. Show work for any values not already outlined above. D. Graph the function you wrote in part C with technology, such as https://www.desmos.com/calculator and insert the graph below. (Be sure to choose appropriate window settings.)E. What is the height of the tide at * = 63x = 63? Show/explain your work

Step by Step Solution

There are 3 Steps involved in it

1 Expert Approved Answer
Step: 1 Unlock blur-text-image
Question Has Been Solved by an Expert!

Get step-by-step solutions from verified subject matter experts

Step: 2 Unlock
Step: 3 Unlock

Students Have Also Explored These Related Mathematics Questions!