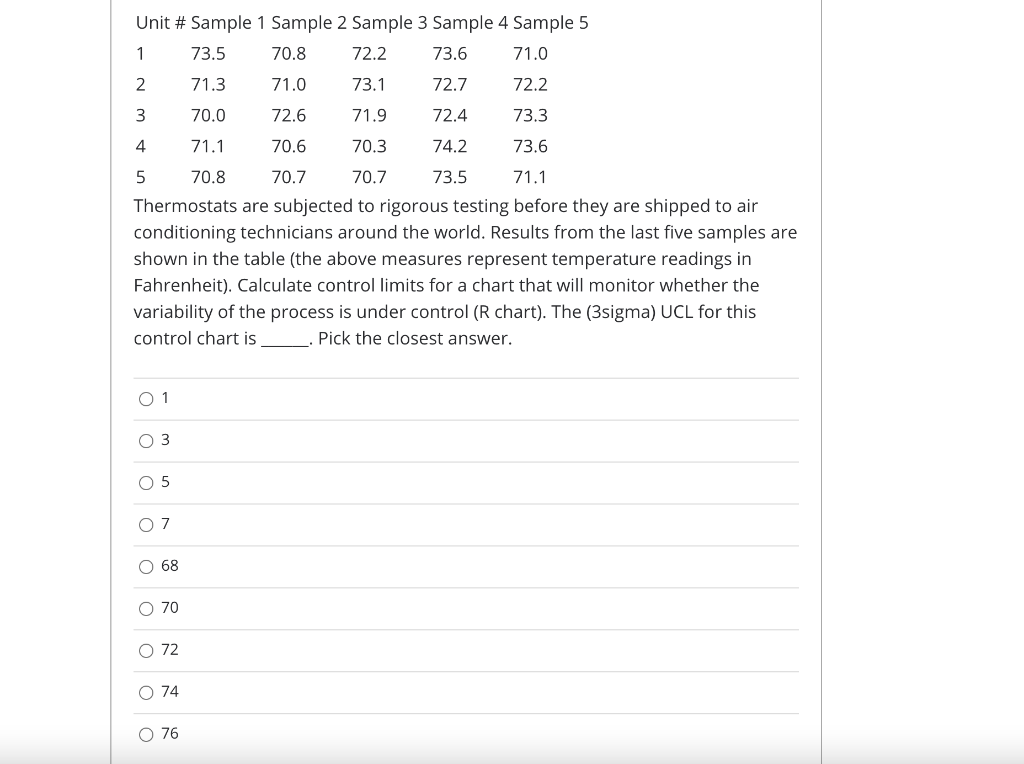
Question: Unit # Sample 1 Sample 2 Sample 3 Sample 4 Sample 5 1 73.5 70.8 72.2 73.6 71.0 2 71.3 71.0 73.1 72.7 72.2 3

Unit # Sample 1 Sample 2 Sample 3 Sample 4 Sample

Unit # Sample 1 Sample 2 Sample 3 Sample 4 Sample 5 1 73.5 70.8 72.2 73.6 71.0 2 71.3 71.0 73.1 72.7 72.2 3 70.0 72.6 71.9 72.4 73.3 4 71.1 70.6 70.3 74.2 73.6 5 70.8 70.7 70.7 73.5 71.1 Thermostats are subjected to rigorous testing before they are shipped to air conditioning technicians around the world. Results from the last five samples are shown in the table (the above measures represent temperature readings in Fahrenheit). Calculate control limits for a chart that will monitor whether the variability of the process is under control (R chart). The (3sigma) UCL for this control chart is _. Pick the closest answer. O1 3 05 7 O 68 076

Step by Step Solution

There are 3 Steps involved in it

1 Expert Approved Answer
Step: 1 Unlock blur-text-image
Question Has Been Solved by an Expert!

Get step-by-step solutions from verified subject matter experts

Step: 2 Unlock
Step: 3 Unlock

Students Have Also Explored These Related General Management Questions!