

Question: Unless specified, all approximationg rectangles are assumed to have the same width. The graph of the function f is given. y = RX) (a) By
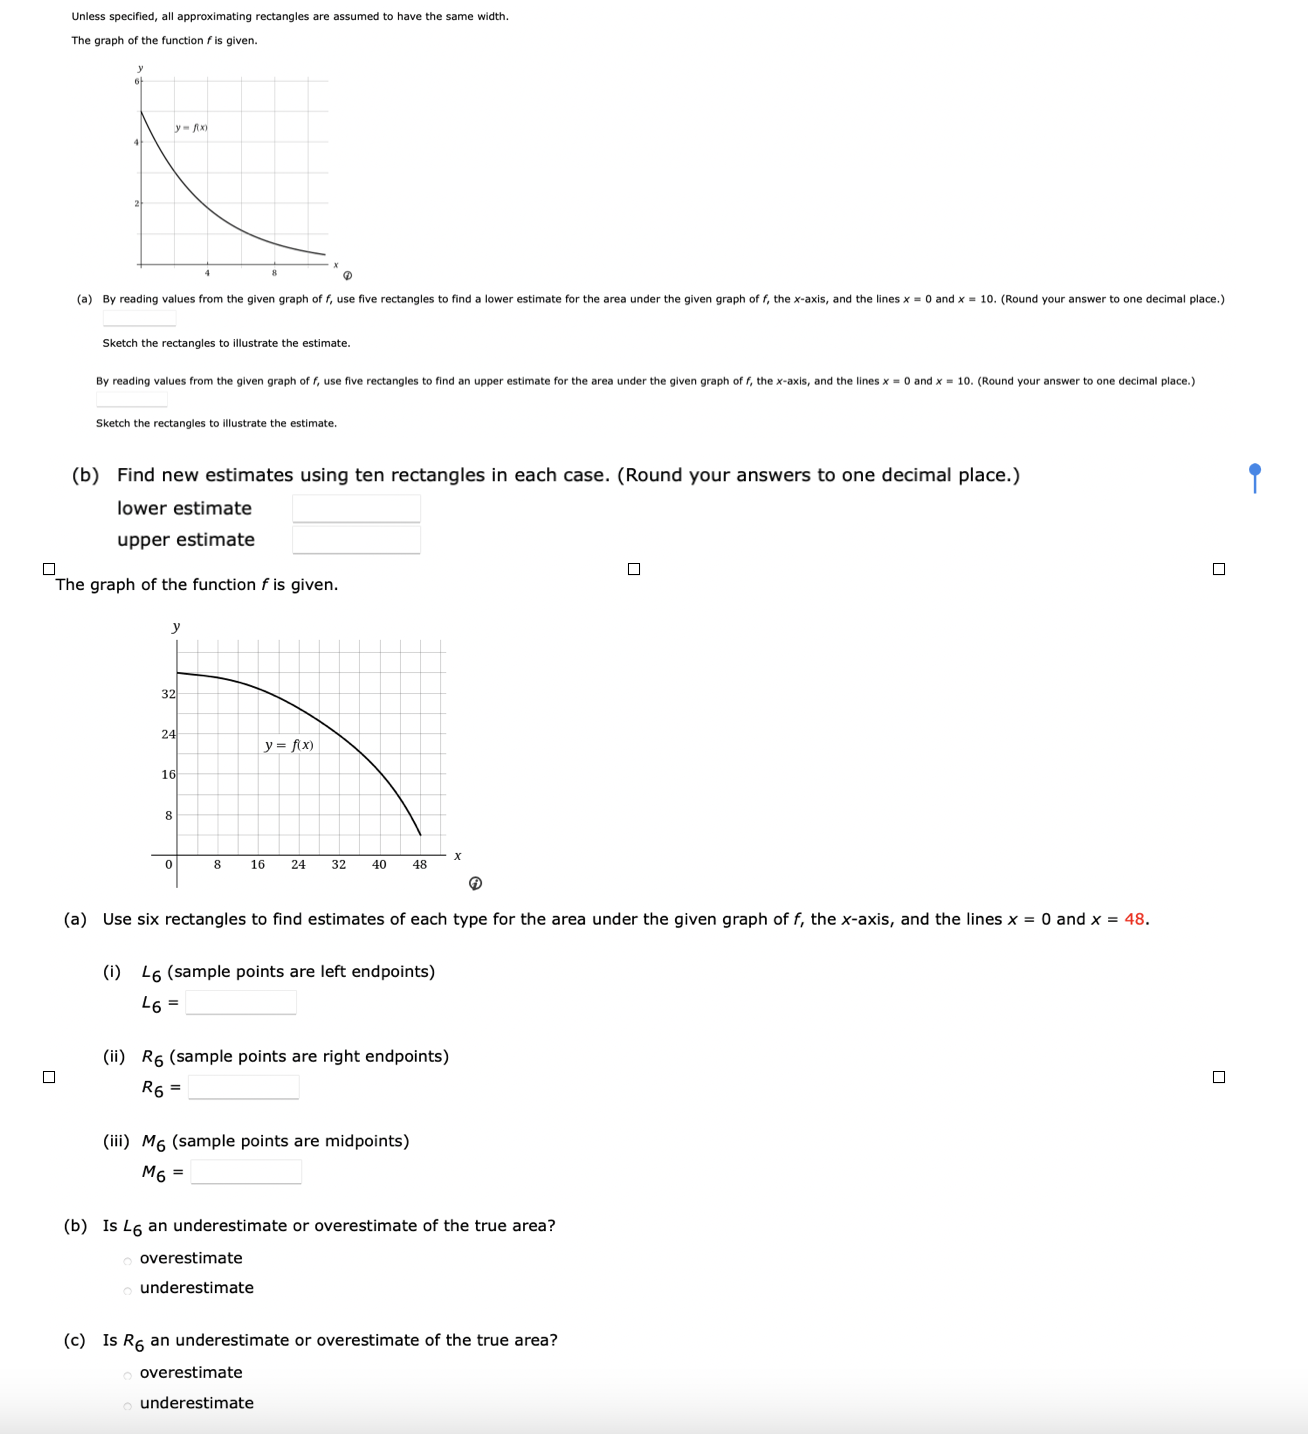

Unless specified, all approximationg rectangles are assumed to have the same width. The graph of the function f is given. y = RX) (a) By reading values from the given graph of f, use five rectangles to find a lower estimate for the area under the given graph of f, the x-axis, and the lines x = 0 and x = 10. (Round your answer to one decimal place.) Sketch the rectangles to illustrate the estimate. By reading values from the given graph of f, use five rectangles to find an upper estimate for the area under the given graph of f, the x-axis, and the lines x = 0 and x = 10. (Round your answer to one decimal place.) Sketch the rectangles to illustrate the estimate. "b) Find new estimates using ten rectangles in each case. (Round your answers to one decimal place.) lower estimate upper estimate "The graph of the function f is given. 32 24 y = f(x) 16 16 24 32 40 48 (a) Use six rectangles to find estimates of each type for the area under the given graph of f, the x-axis, and the lines x = 0 and x = 48. (i) 46 (sample points are left endpoints) L6 = (ii) R6 (sample points are right endpoints) R6 = 0 (ii) M6 (sample points are midpoints) M6 (b) Is L6 an underestimate or overestimate of the true area? overestimate underestimate (c) Is R6 an underestimate or overestimate of the true area? overestimate underestimate
Step by Step Solution
There are 3 Steps involved in it

Get step-by-step solutions from verified subject matter experts