

Question: up load plot Consider the following equation for the reduced viscosity r=(1/MAX)25MAX1 let MAX=0.8 In your plotting program, make a column for =0 to 0.79
up load plot
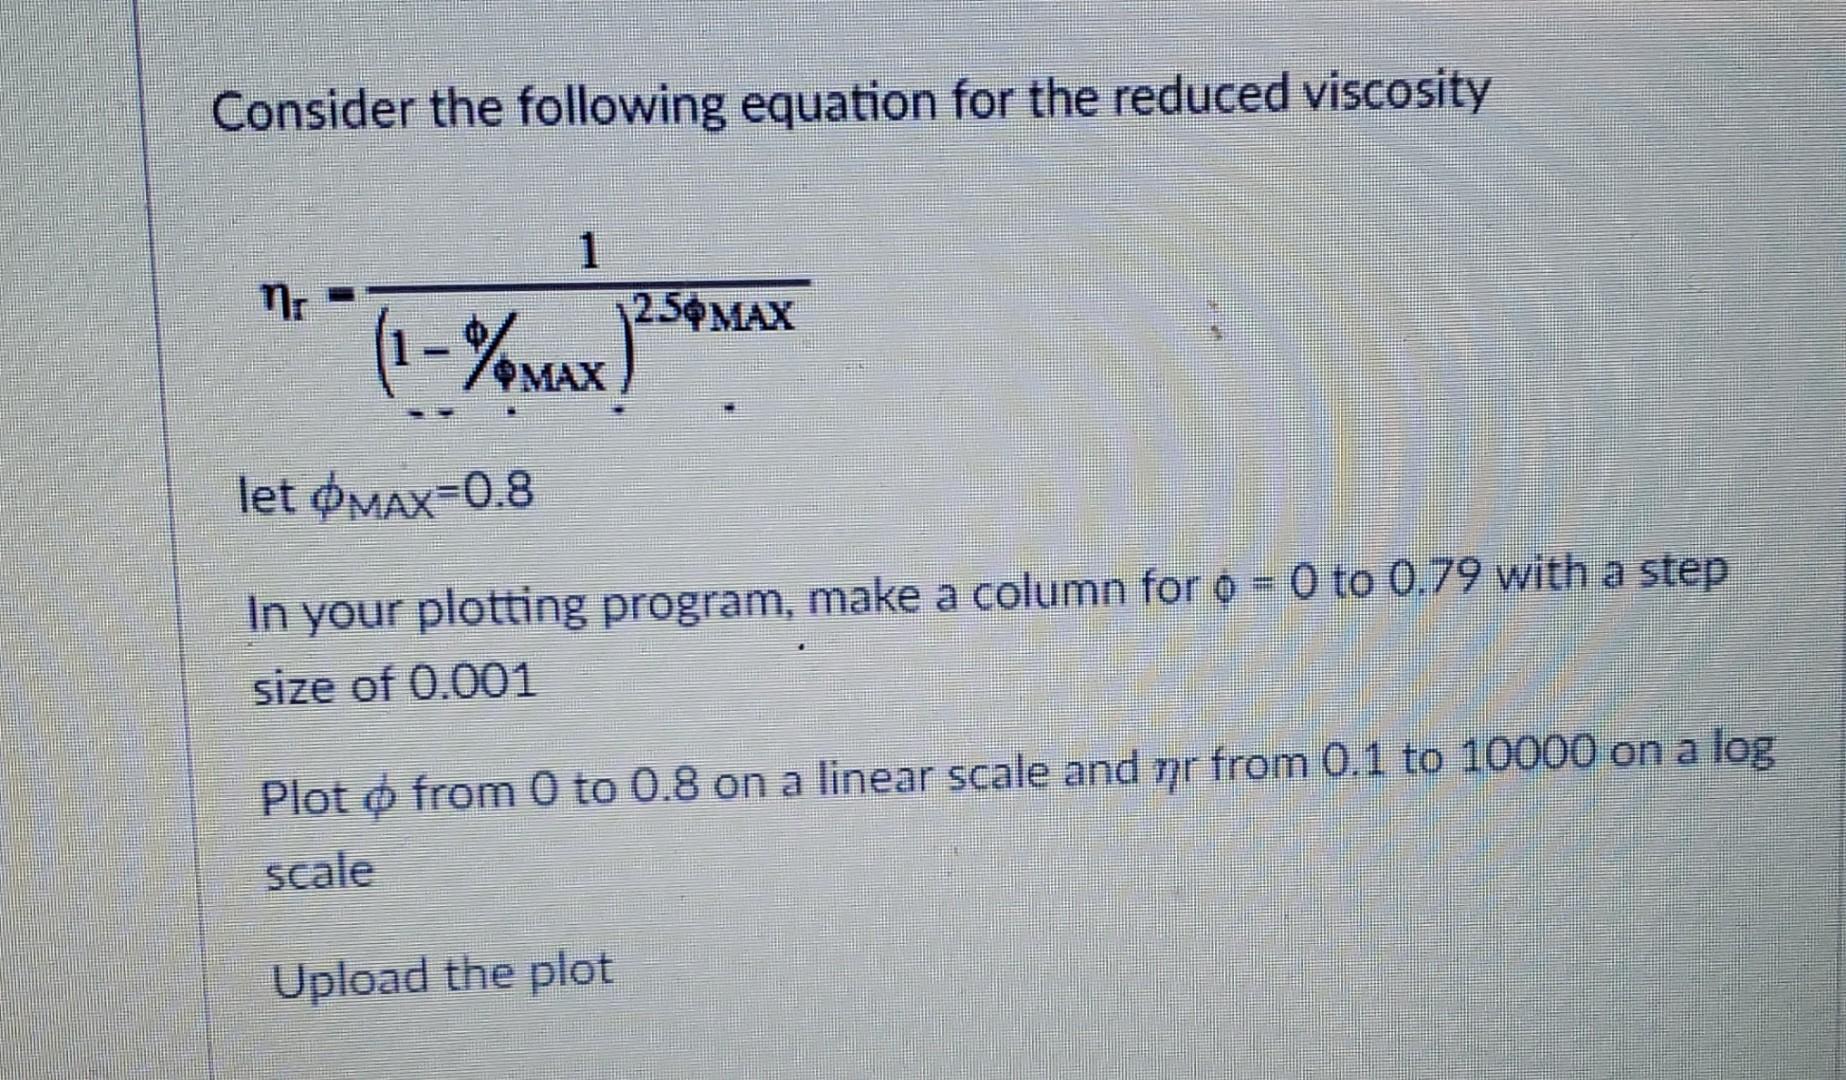
Consider the following equation for the reduced viscosity r=(1/MAX)25MAX1 let MAX=0.8 In your plotting program, make a column for =0 to 0.79 with a step size of 0.001 Plot from 0 to 0.8 on a linear scale and r from 0.1 to 10000 on a log scale Upload the plot
Step by Step Solution
There are 3 Steps involved in it
1 Expert Approved Answer
Step: 1 Unlock

Question Has Been Solved by an Expert!
Get step-by-step solutions from verified subject matter experts
Step: 2 Unlock
Step: 3 Unlock