

Question: Update 1: Apps YouTube Pod Gmail Maps Banner Web Login.. / Guardian Angels s... = Ch. 1 Introduction.. das Family, investigat.. [ Create Thread -C..
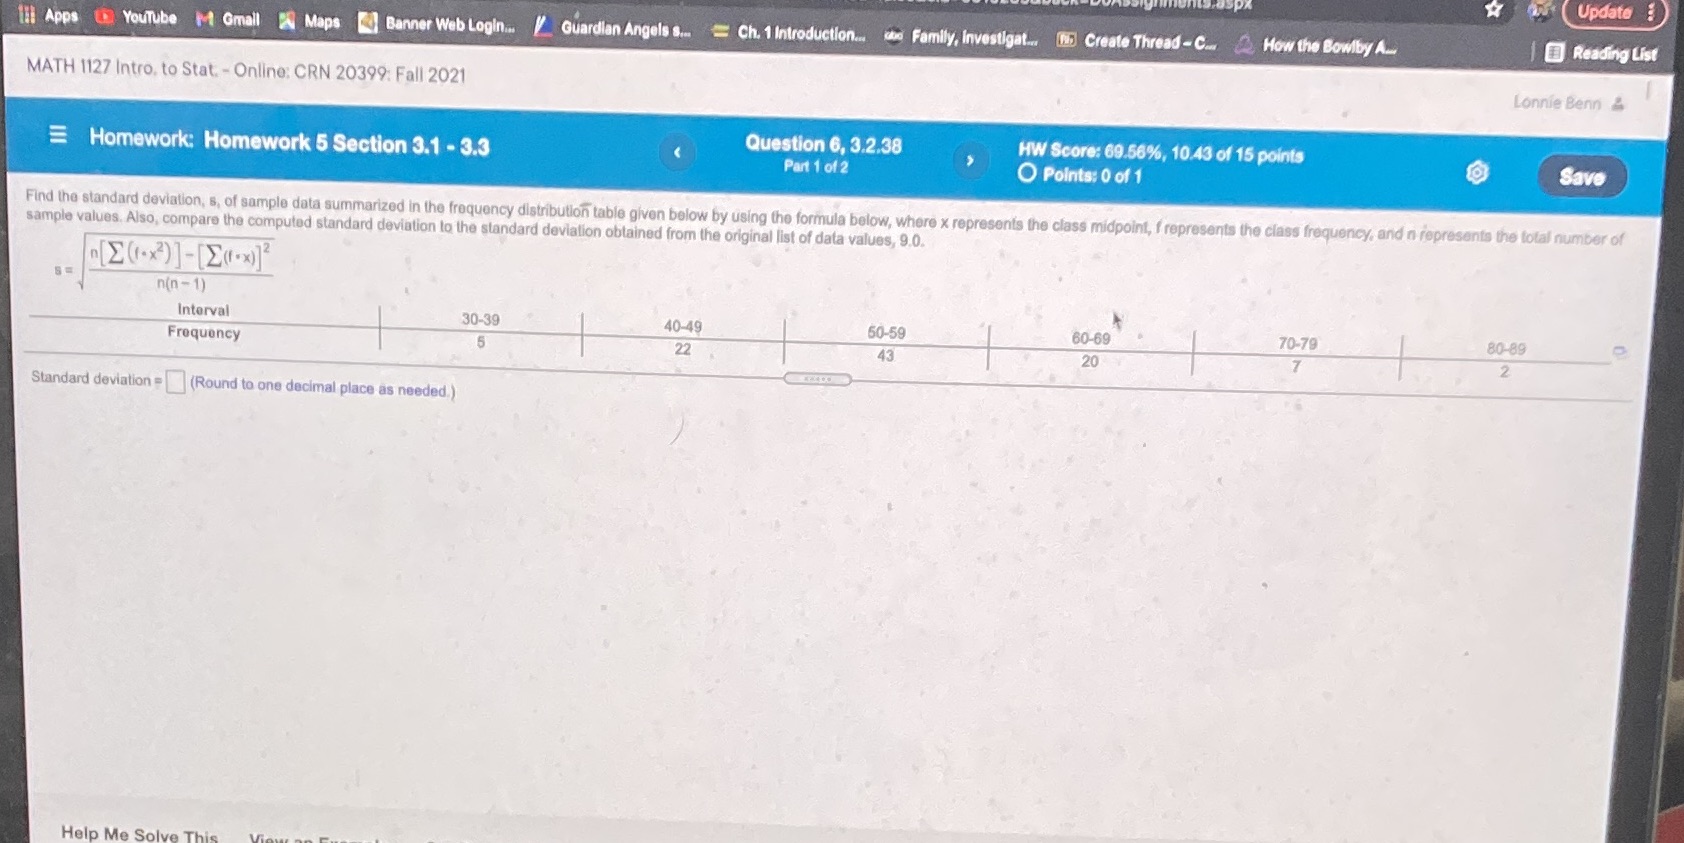
Update 1: Apps YouTube Pod Gmail Maps Banner Web Login.. / Guardian Angels s... = Ch. 1 Introduction.. das Family, investigat.. [ Create Thread -C.. How the Bowlby A.. Reading List MATH 1127 Intro, to Stat. - Online: CRN 20399: Fall 2021 Lonnie Benn Homework: Homework 5 Section 3.1 - 3.3 Question 6, 3.2.38 HW Score: 69.56%, 10.43 of 15 points Part 1 of 2 O Points: 0 of 1 Save Find the standard deviation, s, of sample data summarized in the frequency distribution table given below by using the formula below, where x represents the class midpoint, f represents the class frequency, and ni represents the total number of sample values. Also, compare the computed standard deviation to the standard deviation obtained from the original list of data values, 9.0. [E (.x ) ]- [E(x)] n(n-1) Interval 30-39 40-49 60-59 60-69 70-79 80-89 Frequency 22 43 20 2 Standard deviation = (Round to one decimal place as needed.) Help Me Solve This
Step by Step Solution
There are 3 Steps involved in it

Get step-by-step solutions from verified subject matter experts