

Question: Upload US crime data and compare the murder counts for the states of Alabama, California and Nevada. Your job is to identify the state that
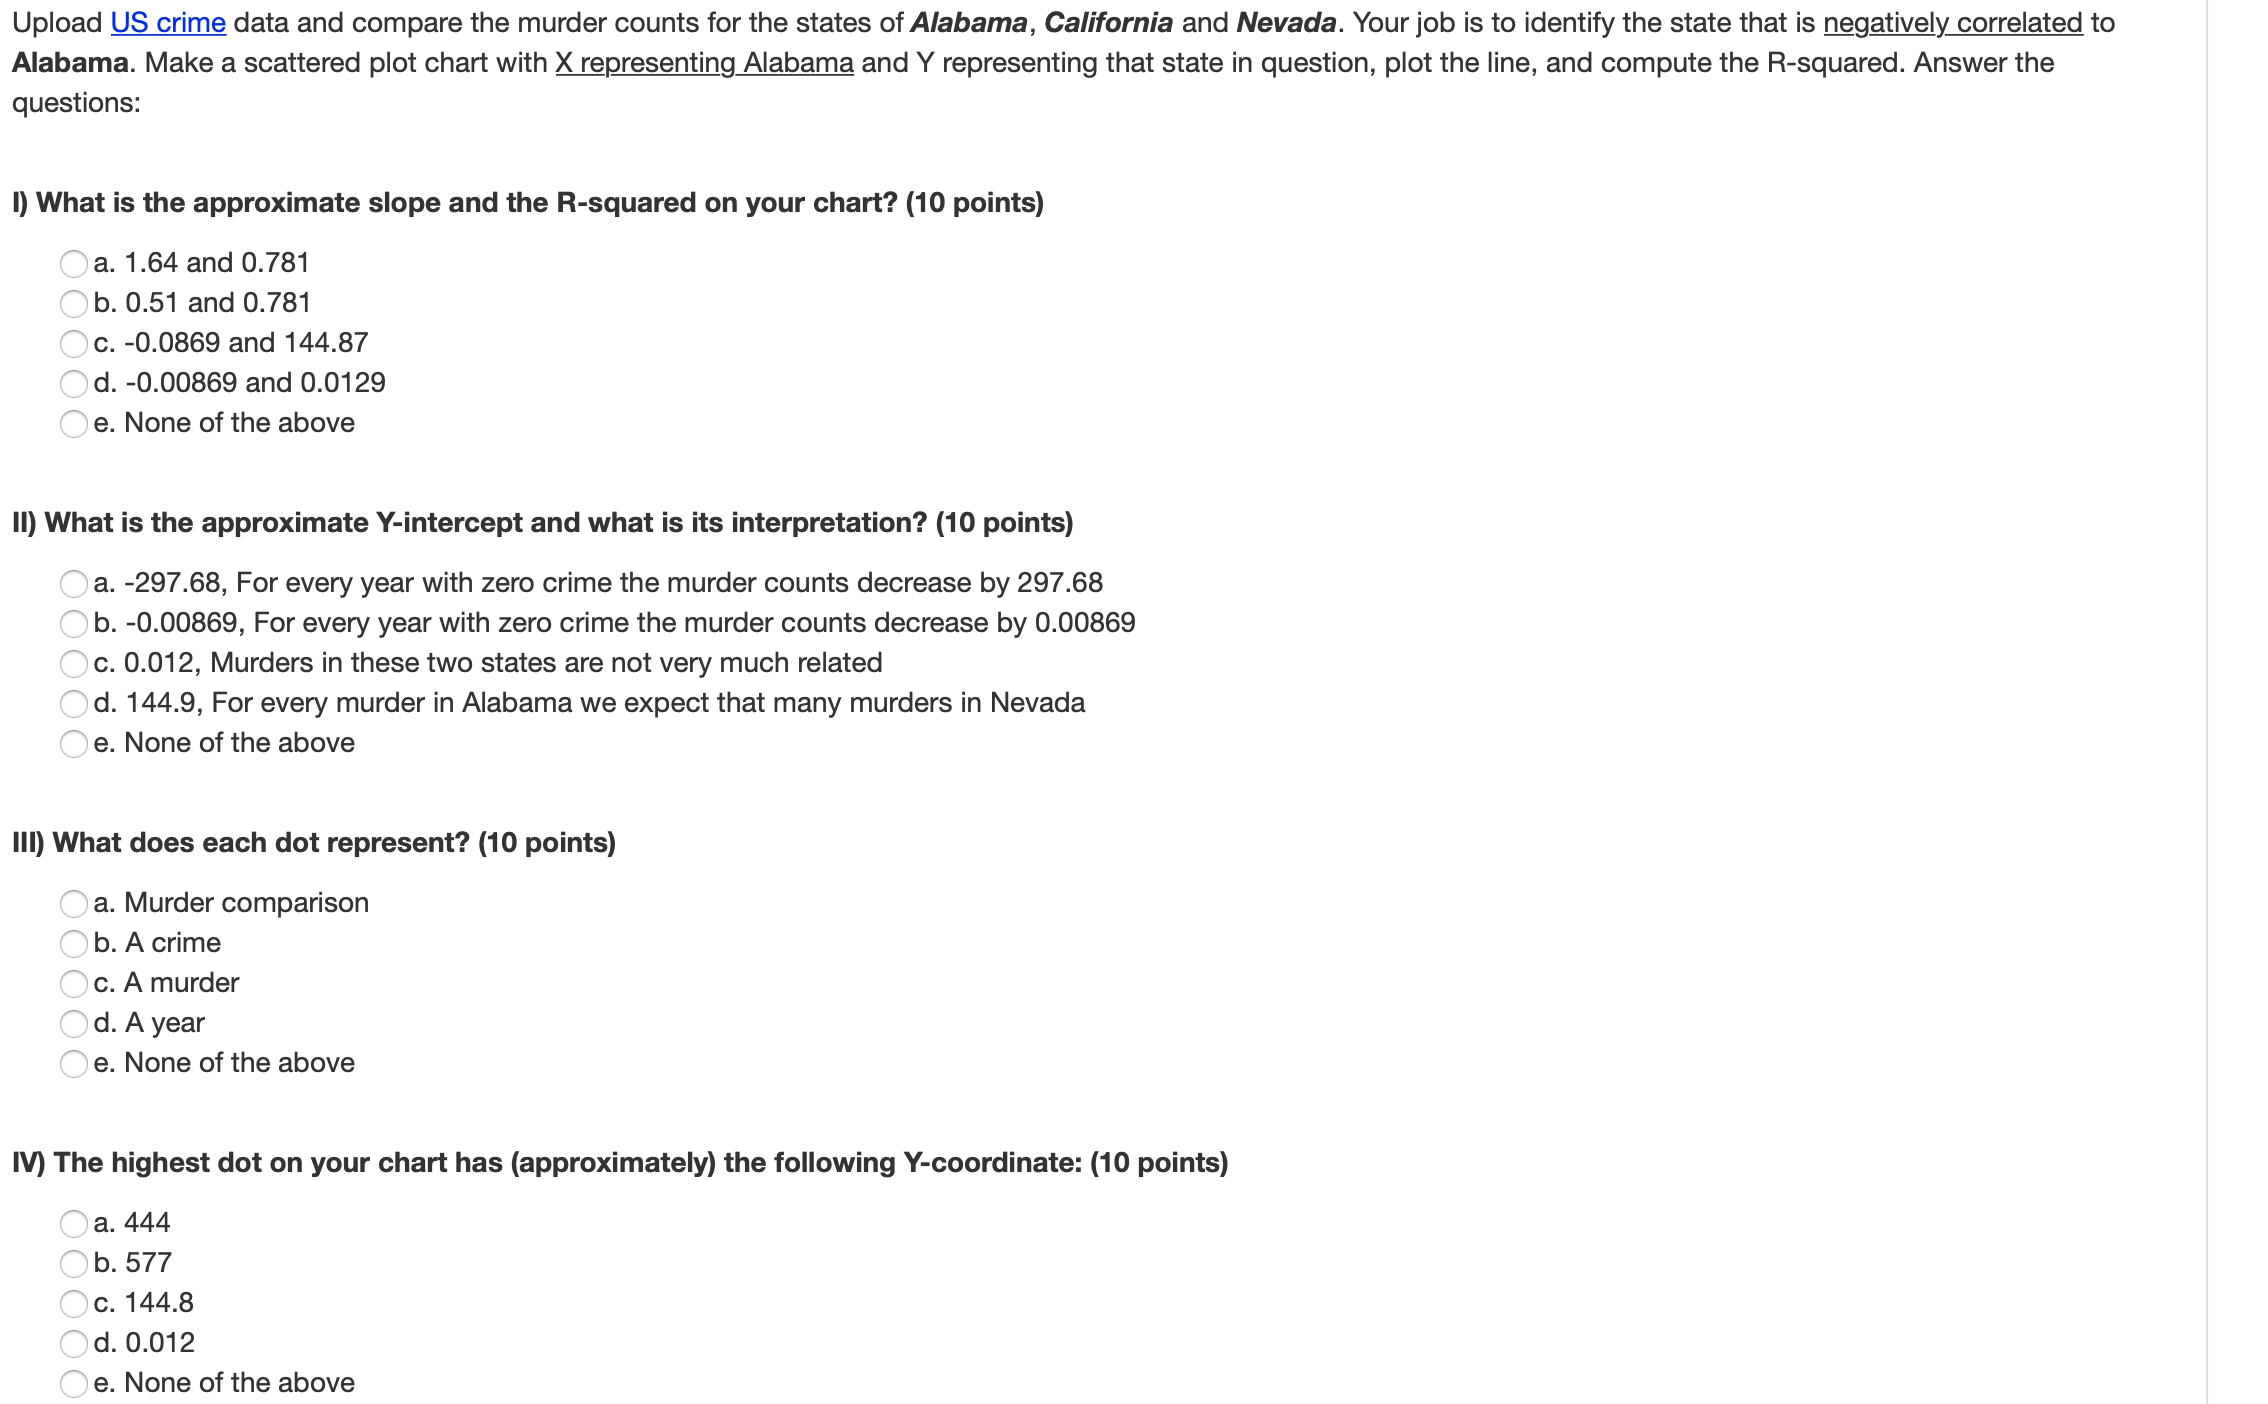
Upload US crime data and compare the murder counts for the states of Alabama, California and Nevada. Your job is to identify the state that is Egatively correlated to Alabama. Make a scattered plot chart with X representing Alabama and Y representing that state in question, plot the line, and compute the R-squared. Answer the questions: I) What is the approximate slope and the R-squared on your chart? (10 points) Aa. 1.64 and 0.781 Ab. 0.51 and 0.781 Ac. -0.0869 and 144.87 Ad. -0.00869 and 0.0129 Ae. None of the above ll) What is the approximate Y-intercept and what is its interpretation? (10 points) A a. -297.68, For every year with zero crime the murder counts decrease by 297.68 A b. -0.00869, For every year with zero crime the murder counts decrease by 0.00869 Ac. 0.012, Murders in these two states are not very much related Ad. 144.9, For every murder in Alabama we expect that many murders in Nevada Ae. None of the above Ill) What does each dot represent? (10 points) A a. Murder comparison A b. A crime A c. A murder A d. A year Ae. None of the above IV) The highest dot on your chart has (approximately) the following Y-coordinate: (10 points) Aa. 444 A b. 577 A c. 144.8 A d. 0.012 Ae. None of the above
Step by Step Solution
There are 3 Steps involved in it

Get step-by-step solutions from verified subject matter experts