

Question: Upper control limit Lower control limit In control? Upper control limit Lower control limit In control? 8.67 1.58 YES Mean Chart Range Chart Please help
Upper control limit Lower control limit In control? Upper control limit Lower control limit In control? 8.67 1.58 YES Mean Chart Range Chart
Please help with Mean and Range.
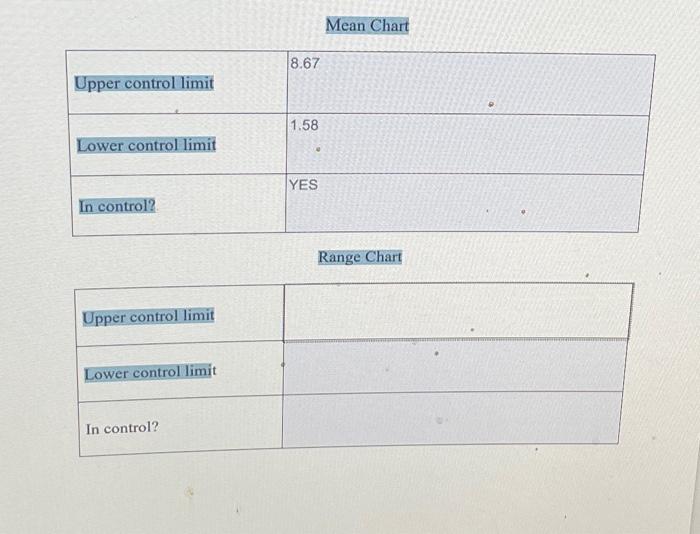
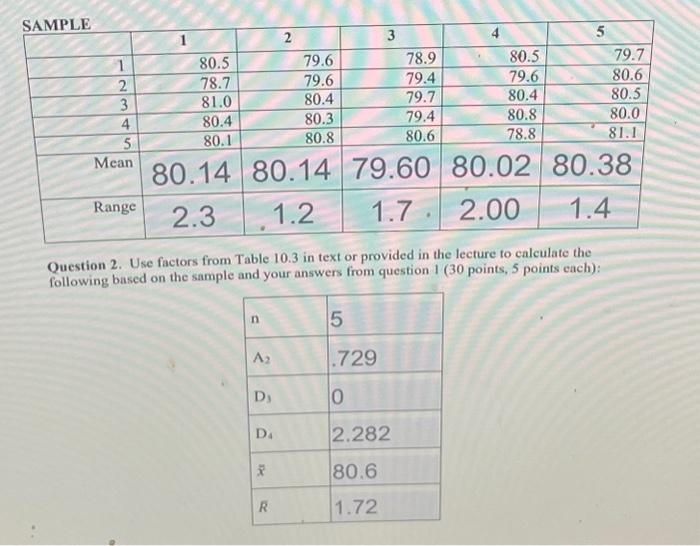
Mean Chart \begin{tabular}{|l|c|} \hline Upper control limit & 8.67 \\ \hline Lower control limit & 1.58 \\ \hline In control? & YES \\ \hline \end{tabular} Range Chart \begin{tabular}{|l|l|} \hline Upper control limit & \\ \hline Lower control limit & \\ \hline In control? & \\ \hline \end{tabular} Question 2. Use factors from Table 10.3 in text or provided in the lecture to calculate the following based on the sample and your answers from question 1 ( 30 points, 5 points each)
Step by Step Solution
There are 3 Steps involved in it
1 Expert Approved Answer
Step: 1 Unlock

Question Has Been Solved by an Expert!
Get step-by-step solutions from verified subject matter experts
Step: 2 Unlock
Step: 3 Unlock