

Question: urgent help, please. I need the plot coordinate and what it looks like when plugged in the graph. The other answers are correct. (b) Write
urgent help, please. I need the plot coordinate and what it looks like when plugged in the graph.
The other answers are correct.
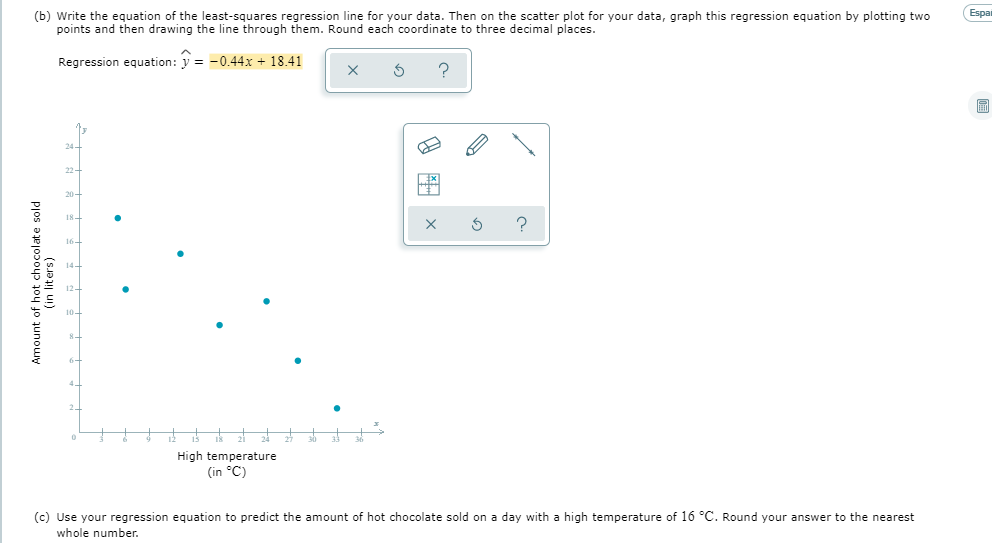
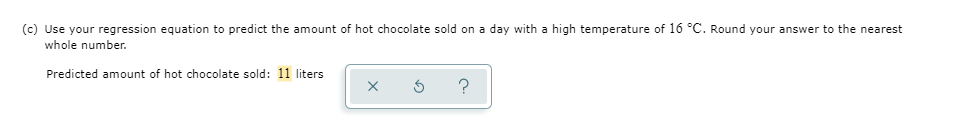
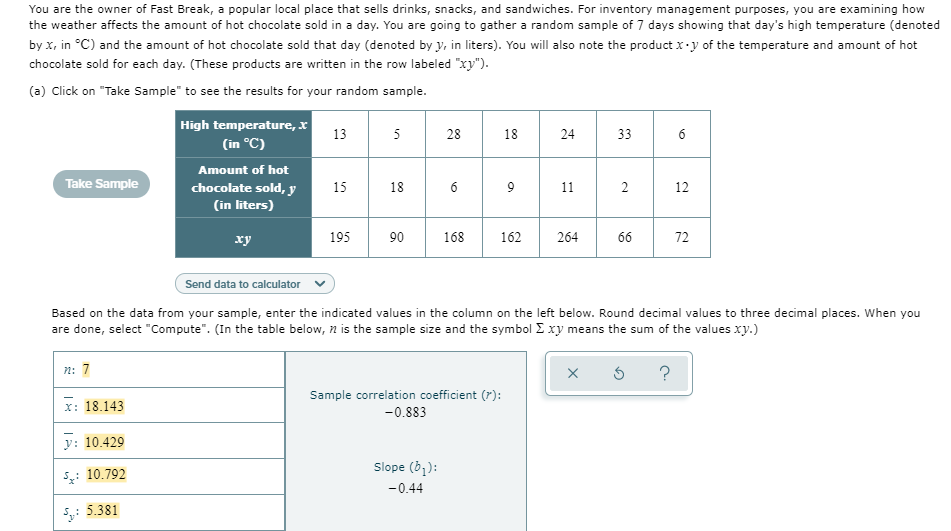
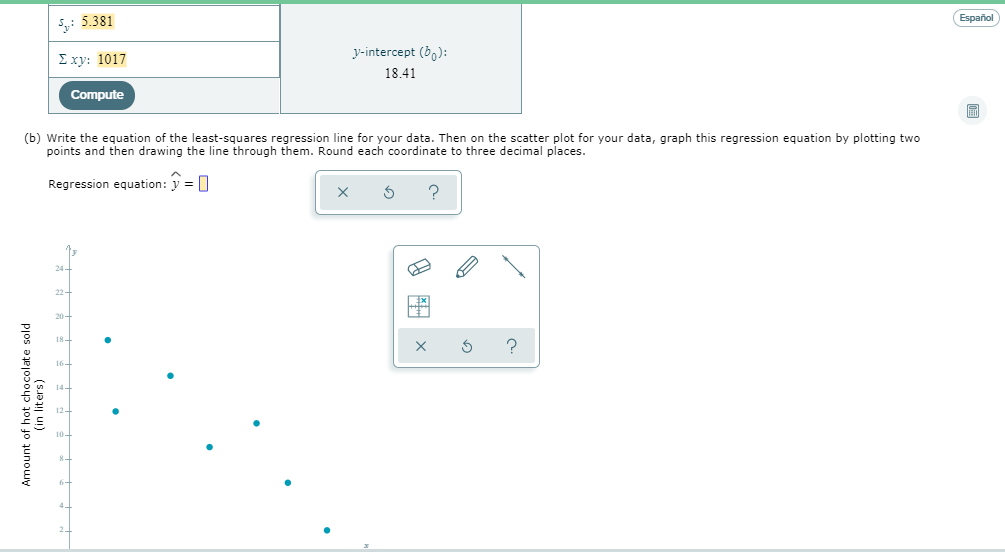
(b) Write the equation of the least-squares regression line for your data. Then on the scatter plot for your data, graph this regression equation by plotting two Espa points and then drawing the line through them. Round each coordinate to three decimal places. Regression equation: y = -0.44x + 18.41 X 5 ? 24- 22- 20- I8- X 5 16- 14 - (in liters ) Amount of hot chocolate sold 10- 2- High temperature (in 'C) (c) Use your regression equation to predict the amount of hot chocolate sold on a day with a high temperature of 16 "C. Round your answer to the nearest whole number.(c) Use your regression equation to predict the amount of hot chocolate sold on a day with a high temperature of 16 "C. Round your answer to the nearest whole number. Predicted amount of hot chocolate sold: 11 liters X 5 ?You are the owner of Fast Break, a popular local place that sells drinks, snacks, and sandwiches. For inventory management purposes, you are examining how the weather affects the amount of hot chocolate sold in a day. You are going to gather a random sample of 7 days showing that day's high temperature (denoted by x, in "C) and the amount of hot chocolate sold that day (denoted by ), in liters). You will also note the product x . ) of the temperature and amount of hot chocolate sold for each day. (These products are written in the row labeled "xy"). (a) Click on "Take Sample" to see the results for your random sample. High temperature, x 13 (in "C) 5 28 18 24 33 6 Amount of hot Take Sample chocolate sold, y 15 18 6 9 11 12 (in liters) xy 195 90 168 162 264 66 72 Send data to calculator v Based on the data from your sample, enter the indicated values in the column on the left below. Round decimal values to three decimal places. When you are done, select "Compute". (In the table below, n is the sample size and the symbol _ xy means the sum of the values xy.) n: 7 X 5 ? x: 18.143 Sample correlation coefficient (7): -0.883 y: 10.429 5,: 10.792 Slope (b ): -0.44 5,: 5.381.1! intercept {bu}: 18.41 (b) Write the equation of the leastsquares regression line for your data. Then on the scatter plot for your data, graph this regression equation by plotting two points and then drawing the line through them. Round each coordinate to three decimal places. A Regression equation: _l.-' = D Amount of hot chocolate sold (in liters)
Step by Step Solution
There are 3 Steps involved in it

Get step-by-step solutions from verified subject matter experts