

Question: URGENT!!! QUESTION 20 From the P&L statement explain what happened to Barclays profits between 2008 and 2012: SOO 28,010 10.606 11.416 0.400 1.082 8,407 1.RO
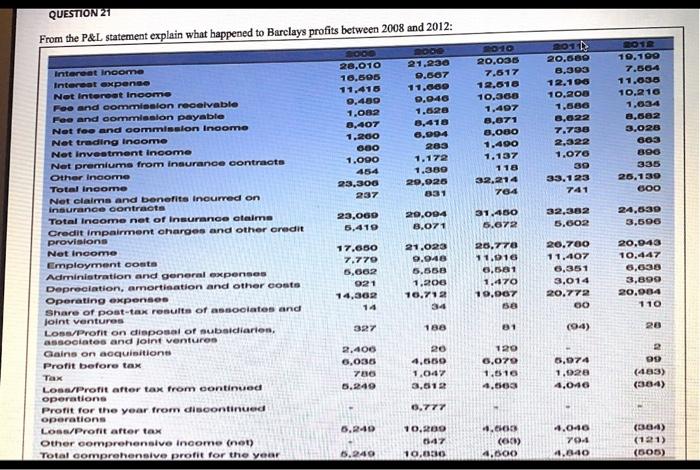
QUESTION 20 From the P&L statement explain what happened to Barclays profits between 2008 and 2012: SOO 28,010 10.606 11.416 0.400 1.082 8,407 1.RO 600 1.000 454 23,300 237 21.230 0.807 11.000 0.046 1.620 8,418 6.004 283 1.172 1.300 20,026 831 2010 20.036 7.617 12.610 10.366 1.407 8,071 8.080 1.490 1.137 118 32,214 784 2010 20.680 8,303 12.196 10.200 1.686 8,022 7.738 2.322 1.076 30 33.1 23 2018 10,100 7.564 11.036 10.216 1,034 8.682 3.028 603 390 335 26,130 600 741 Interest income Interest expense Not Interest Income Foo and commission receivable Fee and commission payable Not fee and commission Income Net trading income Not Inveetment income Net premiums from insurance contracts Other Income Total income Net claims and benefits incurred on insurance contracts Total income net of insurance claims Credit Impairment charges and other credit provisions Not Income Employment conta Administration and general expenses Depreciation, amortisation and other conto Operating expenson Share of post-tax results of associates and joint ventures LOS/Profit on disposal of subsidiarien, associates and joint ventures Gains on acquisition Profit before tax 23,060 5,419 20.094 3.071 31,450 5.672 32,382 5,602 24.639 3,606 17.000 7.770 6,062 021 14.302 14 21.023 9.048 5,658 1.200 10,712 20.770 11.016 6.581 1.470 19,967 58 20.700 11.407 6,351 3,014 20.772 00 20,043 10,447 6,038 3,800 20.000 110 34 327 188 31 (04) 2.400 6,036 786 6.249 20 4.600 1.0447 3,012 120 6.079 1,0510 4.063 6,074 1,028 4,046 R OD (483) (384) 0,777 LOS/Pront after tax from continued operations Profit for the year from discontinued operations LOS/Profit after tax other comprehensive Income (net) Total comprehensive profit for the year 0.240 10,800 047 10.00 4.00 (0) 4,500 4.040 704 4,840 (300) (121) (505) 6.240 QUESTION 20 From the P&L statement explain what happened to Barclays profits between 2008 and 2012: SOO 28,010 10.606 11.416 0.400 1.082 8,407 1.RO 600 1.000 454 23,300 237 21.230 0.807 11.000 0.046 1.620 8,418 6.004 283 1.172 1.300 20,026 831 2010 20.036 7.617 12.610 10.366 1.407 8,071 8.080 1.490 1.137 118 32,214 784 2010 20.680 8,303 12.196 10.200 1.686 8,022 7.738 2.322 1.076 30 33.1 23 2018 10,100 7.564 11.036 10.216 1,034 8.682 3.028 603 390 335 26,130 600 741 Interest income Interest expense Not Interest Income Foo and commission receivable Fee and commission payable Not fee and commission Income Net trading income Not Inveetment income Net premiums from insurance contracts Other Income Total income Net claims and benefits incurred on insurance contracts Total income net of insurance claims Credit Impairment charges and other credit provisions Not Income Employment conta Administration and general expenses Depreciation, amortisation and other conto Operating expenson Share of post-tax results of associates and joint ventures LOS/Profit on disposal of subsidiarien, associates and joint ventures Gains on acquisition Profit before tax 23,060 5,419 20.094 3.071 31,450 5.672 32,382 5,602 24.639 3,606 17.000 7.770 6,062 021 14.302 14 21.023 9.048 5,658 1.200 10,712 20.770 11.016 6.581 1.470 19,967 58 20.700 11.407 6,351 3,014 20.772 00 20,043 10,447 6,038 3,800 20.000 110 34 327 188 31 (04) 2.400 6,036 786 6.249 20 4.600 1.0447 3,012 120 6.079 1,0510 4.063 6,074 1,028 4,046 R OD (483) (384) 0,777 LOS/Pront after tax from continued operations Profit for the year from discontinued operations LOS/Profit after tax other comprehensive Income (net) Total comprehensive profit for the year 0.240 10,800 047 10.00 4.00 (0) 4,500 4.040 704 4,840 (300) (121) (505) 6.240
Step by Step Solution
There are 3 Steps involved in it

Get step-by-step solutions from verified subject matter experts