

Question: URGENT STATISTICS QUESTION: 2.3.4 Practice - Checking for Normal Distributions Please see the image attached below. Thank you! . The data listed here are the
URGENT STATISTICS QUESTION: 2.3.4 Practice - Checking for Normal Distributions
Please see the image attached below. Thank you!
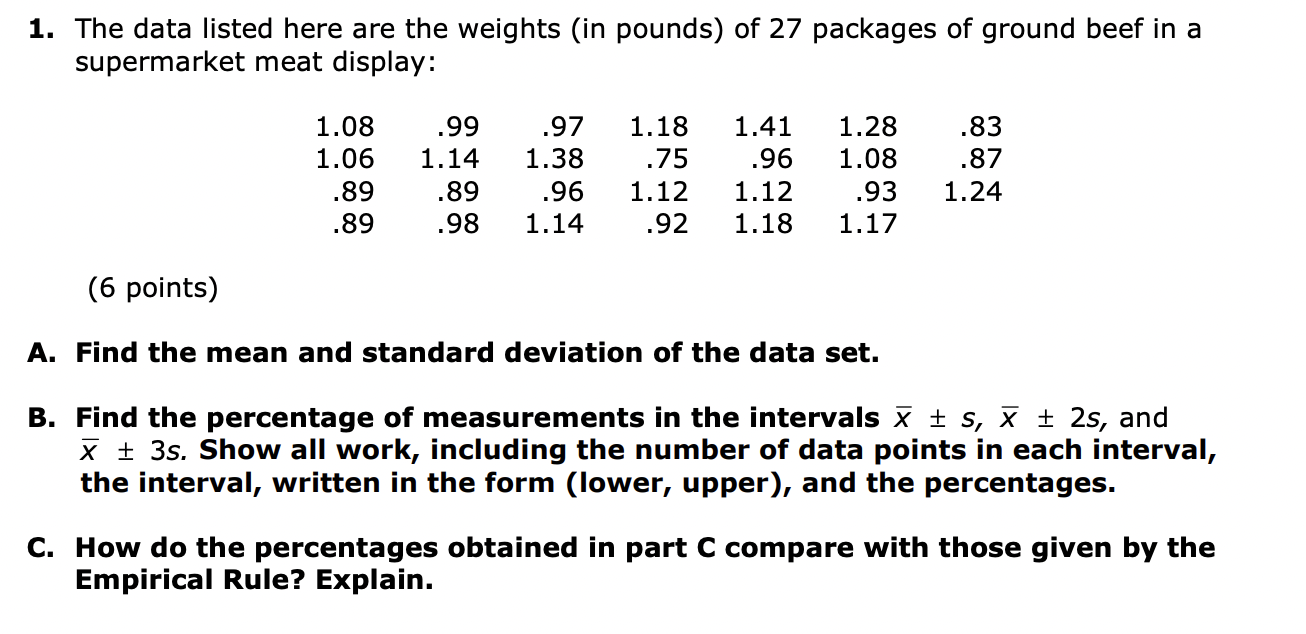
. The data listed here are the weights (in pounds) of 27 packages of ground beef in a supermarket meat display: 1.08 .99 .97 1.18 1.41 1.28 .83 1.06 1.14 1.38 .75 .96 1.08 .87 .89 .89 .96 1.12 1.12 .93 1.24 .89 .98 1.14 .92 1.18 1.17 (6 points) . Find the mean and standard deviation of the data set. . Find the percentage of measurements in the intervals )7 i s, )7 i 25, and )7 i 35. Show all work, including the number of data points in each interval, the interval, written in the form (lower, upper), and the percentages. . How do the percentages obtained in part C compare with those given by the Empirical Rule? Explain
Step by Step Solution
There are 3 Steps involved in it

Get step-by-step solutions from verified subject matter experts