

Question: US population 50,000,000 - 30,000,000- US population (census) 10,000,000 5,000,000 - 1790 1800 1810 1820 1830 1840 1850 1860 1870 1880 Year 4. What feature

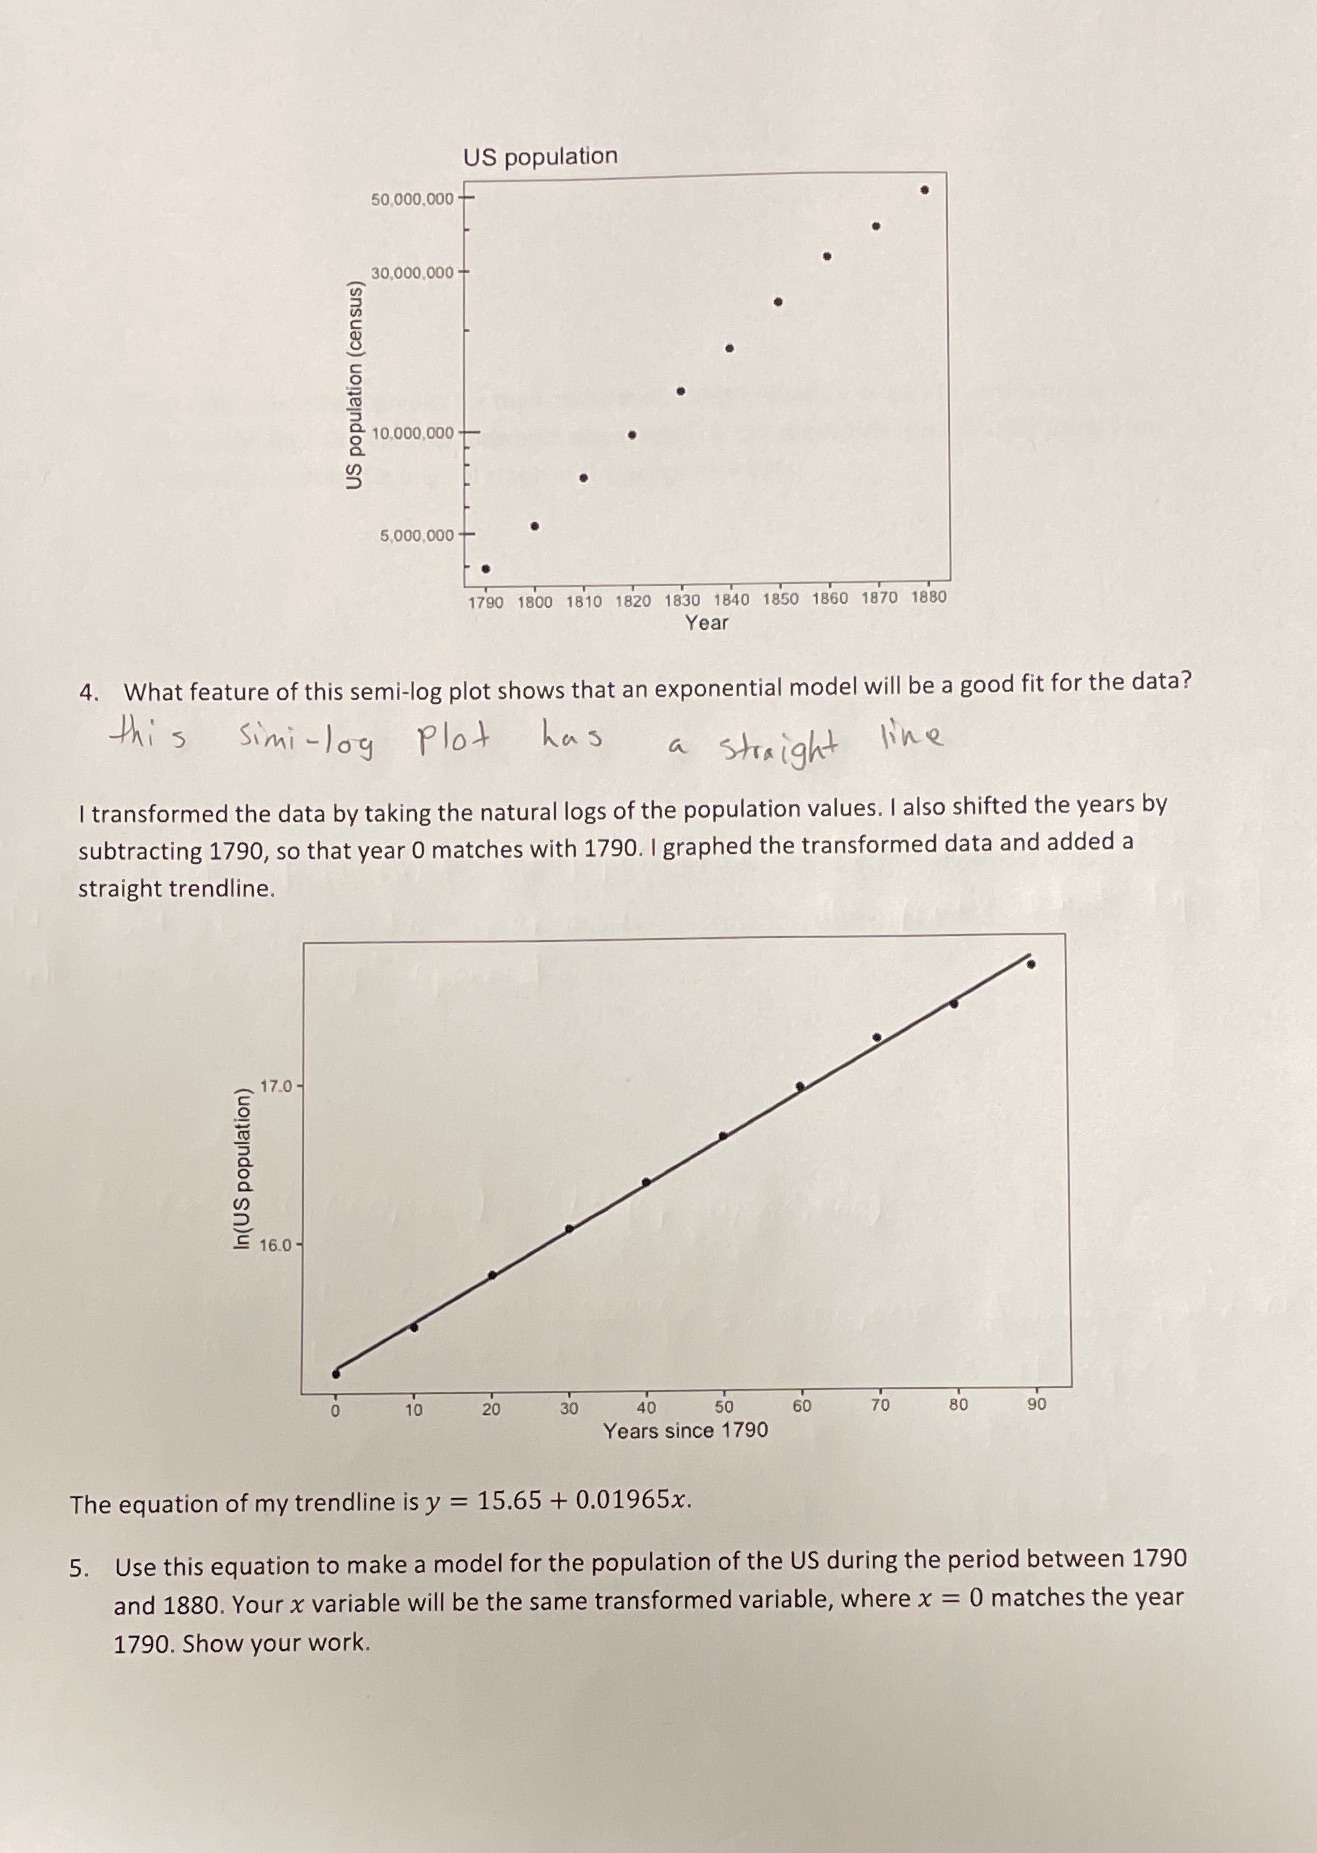
US population 50,000,000 - 30,000,000- US population (census) 10,000,000 5,000,000 - 1790 1800 1810 1820 1830 1840 1850 1860 1870 1880 Year 4. What feature of this semi-log plot shows that an exponential model will be a good fit for the data? this simi-log plot has a straight line I transformed the data by taking the natural logs of the population values. I also shifted the years by subtracting 1790, so that year 0 matches with 1790. I graphed the transformed data and added a straight trendline. 17.0 In(US population) 160 - 20 30 40 50 60 70 80 90 Years since 1790 The equation of my trendline is y = 15.65 + 0.01965x. 5. Use this equation to make a model for the population of the US during the period between 1790 and 1880. Your x variable will be the same transformed variable, where x = 0 matches the year 1790. Show your work
Step by Step Solution
There are 3 Steps involved in it

Get step-by-step solutions from verified subject matter experts