

Question: Use 2 scores to compare the given values. Based on sample data, newborn males have weights with a mean of 3202.9 9 and a standard
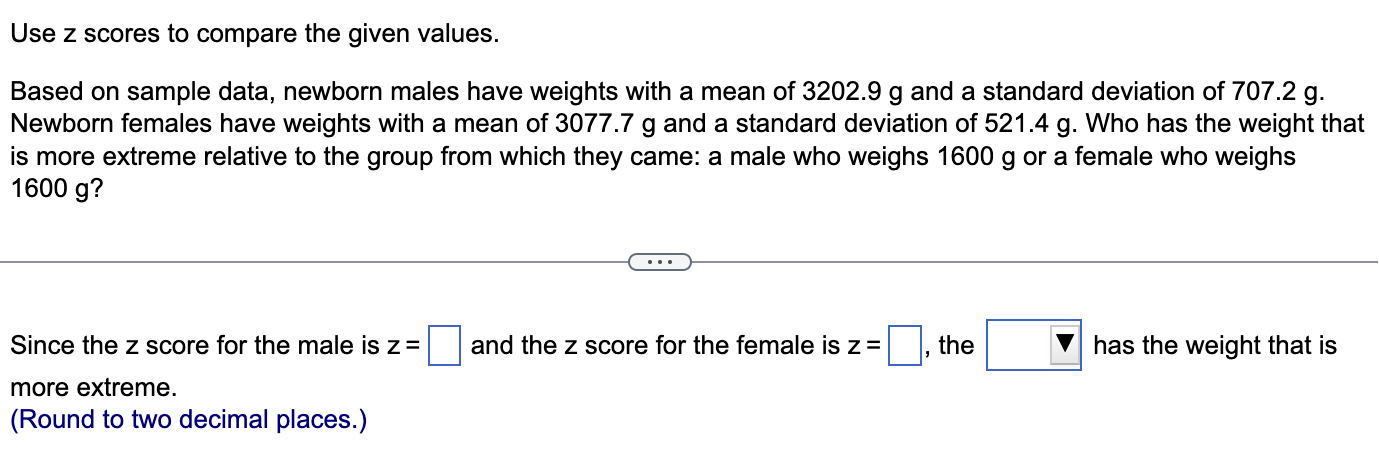
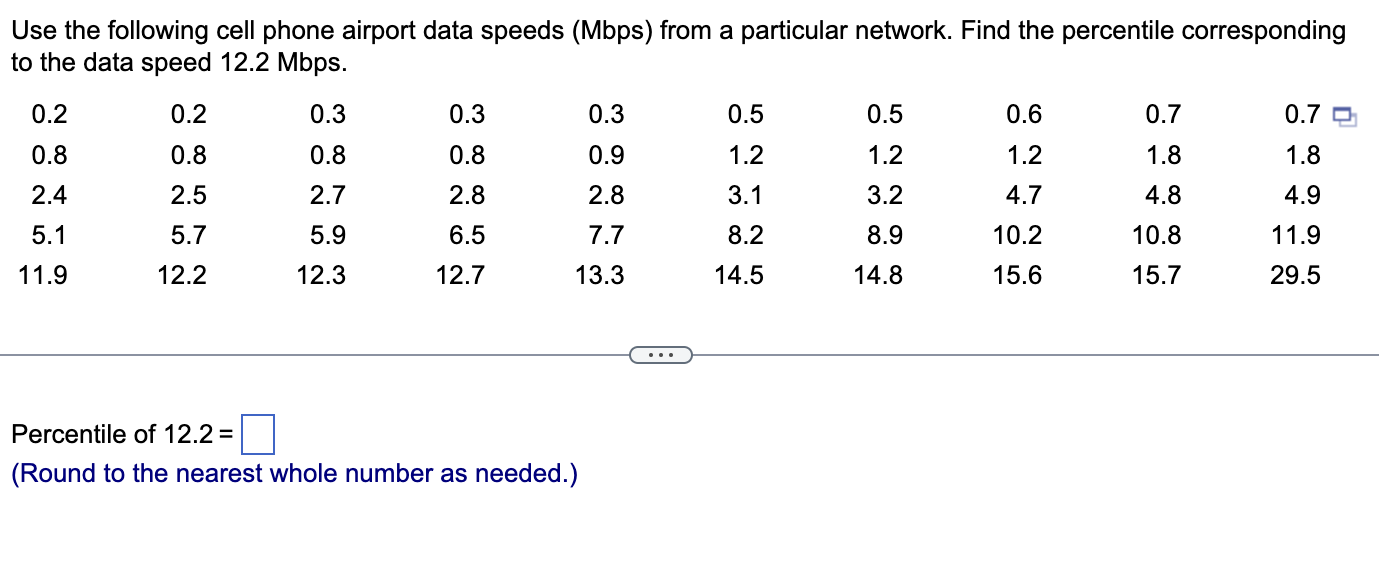
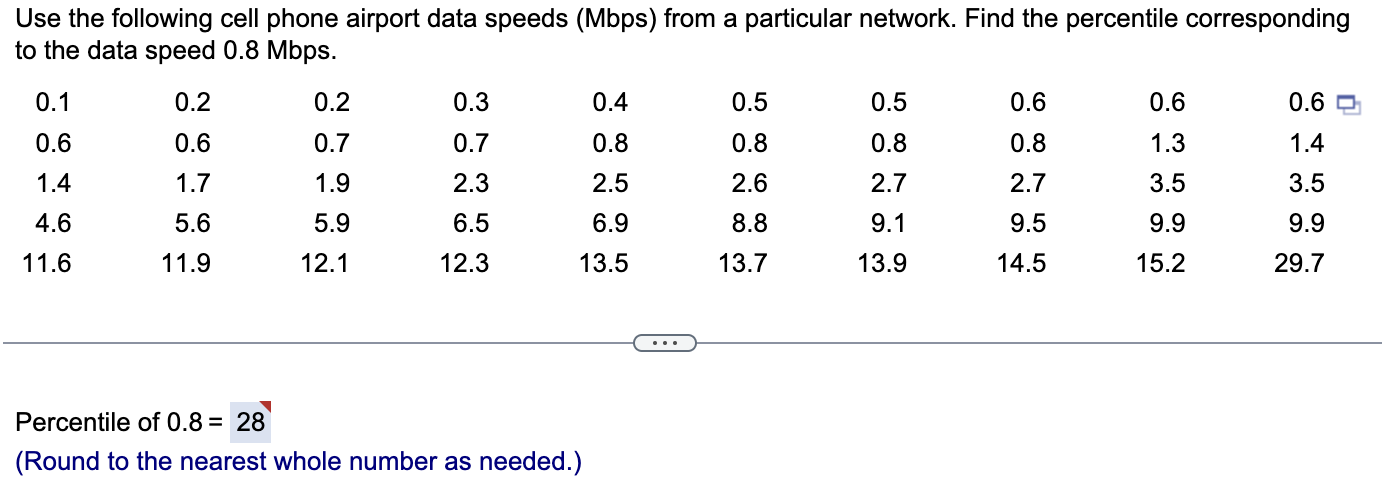
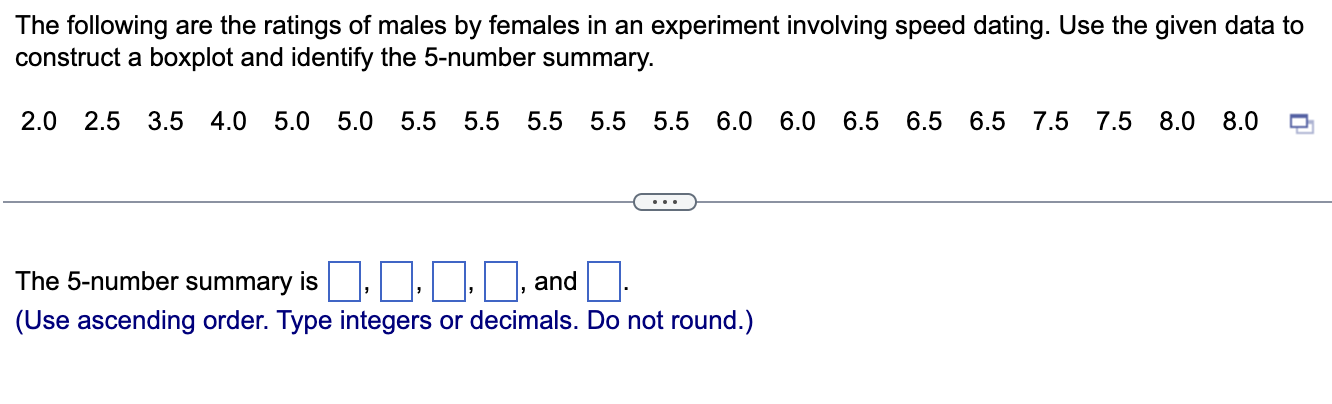
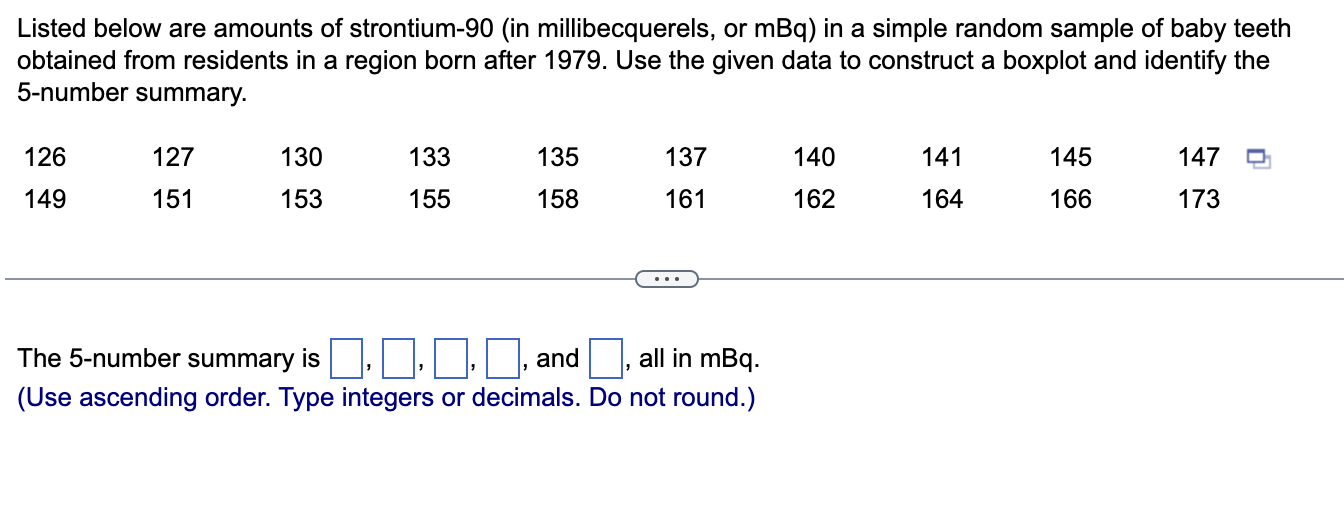
Use 2 scores to compare the given values. Based on sample data, newborn males have weights with a mean of 3202.9 9 and a standard deviation of 707.2 g. Newborn females have weights with a mean of 3077.7 9 and a standard deviation of 521 .4 9. Who has the weight that is more extreme relative to the group from which they came: a male who weighs 1600 g or a female who weighs 1600 g? Since the z score for the male is z = D and the z score for the female is z = D, the |:l has the weight that is more extreme. (Round to two decimal places.) Use the following cell phone airport data speeds (Mbps) from a particular network. Find the percentile corresponding to the data speed 12.2 Mbps. 0.2 0.2 0.3 0.3 0.3 0.5 0.5 0.6 0.7 0.7 D. 0.8 0.8 0.8 0.8 0.9 1.2 1.2 1.2 1.8 1.8 2.4 2.5 2.7 2.8 2.8 3.1 3.2 4.7 4.8 4.9 5.1 5.7 5.9 6.5 7.7 8.2 8.9 10.2 10.8 11.9 11.9 12.2 12.3 12.7 13.3 14.5 14.8 15.6 15.7 29.5 E> Percentile of 12.2 = D (Round to the nearest whole number as needed.) Use the following cell phone airport data speeds (Mbps) from a particular network. Find the percentile corresponding to the data speed 0.8 Mbps. 0.1 0.2 0.2 0.3 0.4 0.5 0.5 0.6 0.6 0.6 D: 0.6 0.6 0.7 0.7 0.8 0.8 0.8 0.8 1.3 1.4 1.4 1.7 1.9 2.3 2.5 2.6 2.7 2.7 3.5 3.5 4.6 5.6 5.9 6.5 6.9 8.8 9.1 9.5 9.9 9.9 11.6 11.9 12.1 12.3 13.5 13.7 13.9 14.5 15.2 29.7 <:> Percentile of 0.8 = 23' (Round to the nearest whole number as needed.) The following are the ratings of males by females in an experiment involving speed dating. Use the given data to construct a boxplot and identify the 5-number summary. 2.0 2.5 3.5 4.0 5.0 5.0 5.5 5.5 5.5 5.5 5.5 6.0 6.0 6.5 6.5 6.5 7.5 7.5 8.0 8.0 . . . The 5-number summary is and (Use ascending order. Type integers or decimals. Do not round.)Listed below are amounts of strontium-90 (in millibecquerels, or mBq) in a simple random sample of baby teeth obtained from residents in a region born after 1979. Use the given data to construct a boxplot and identify the 5-number summary. 126 127 130 133 135 137 140 141 145 147 0 149 151 153 155 158 161 162 164 166 173 . . . The 5-number summary is L and , all in mBq. (Use ascending order. Type integers or decimals. Do not round.)
Step by Step Solution
There are 3 Steps involved in it

Get step-by-step solutions from verified subject matter experts