

Question: Use a cubic polynomial strain energy function W (Eoo, Ezz) = A(Eoo)2 + BEooEzz + C(Ezz)2 + D(Ego)3 + E(Eoo)2Ezz + FEoo(Ezz)2 + G(Ezz) 3
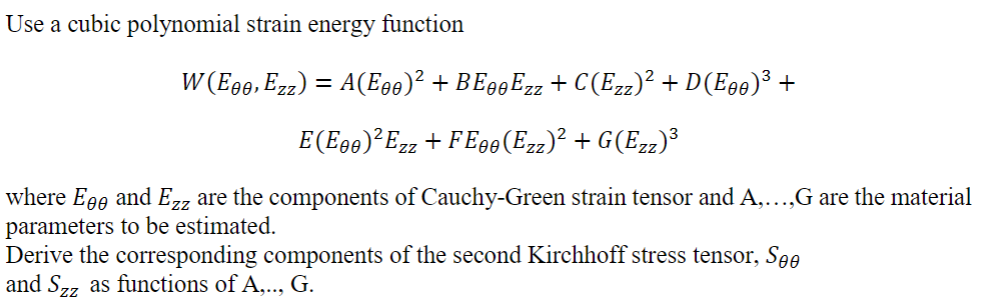
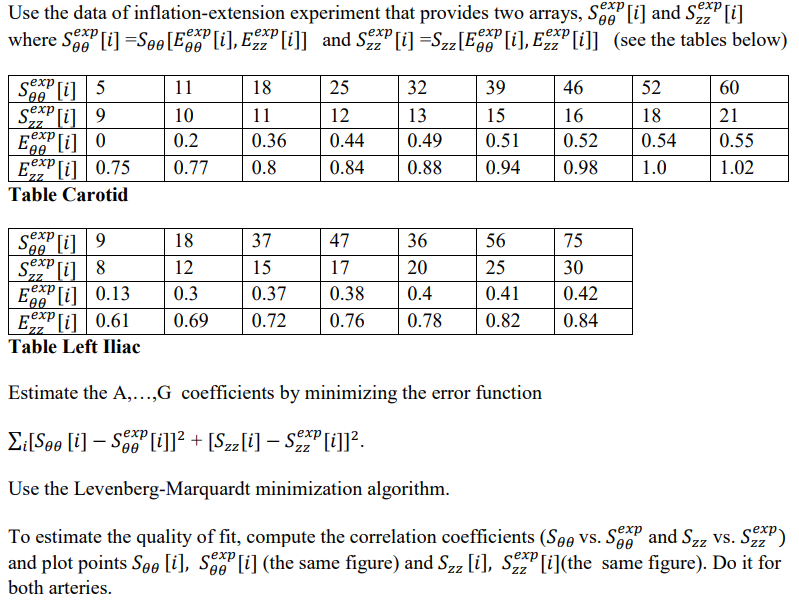
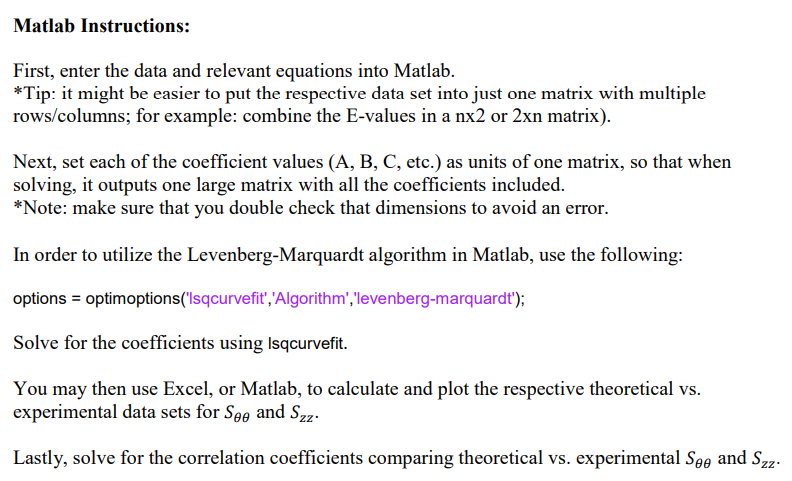
Use a cubic polynomial strain energy function W (Eoo, Ezz) = A(Eoo)2 + BEooEzz + C(Ezz)2 + D(Ego)3 + E(Eoo)2Ezz + FEoo(Ezz)2 + G(Ezz) 3 where Eno and Ezz are the components of Cauchy-Green strain tensor and A,...,G are the material parameters to be estimated. Derive the corresponding components of the second Kirchhoff stress tensor, See and Szz as functions of A,.., G.Use the data of inflation-extension experiment that provides two arrays, See Sep [i] and Sexp where See [i] =Soo[Egg [il, Ezz [i]] and Szz"[i] =Szz[Egg [i], Ezz [i]] (see the tables below) SAB [i] 5 11 18 25 32 39 46 52 60 SexP [i] 9 10 11 12 13 15 16 18 21 gexp [i] 0 0.2 0.36 0.44 0.49 0.51 0.52 0.54 0.55 EP [i] 0.75 0.77 0.8 0.84 0.88 0.94 0.98 1.0 1.02 Table Carotid See [?] 9 18 37 47 36 56 75 Sexp 8 12 15 17 20 25 30 0.13 0.3 0.37 0.38 0.4 0.41 0.42 Fexp [i] 0.61 0.69 0.72 0.76 0.78 0.82 0.84 Table Left Iliac Estimate the A,...,G coefficients by minimizing the error function ZilSoo [i] - See [i]]2 + [Szz [i] - SexP [i]]2. Use the Levenberg-Marquardt minimization algorithm. To estimate the quality of fit, compute the correlation coefficients (See vs. See and Szz VS. Szz) and plot points See [i], See [i] (the same figure) and Szz [i], Sez[i]( the same figure). Do it for both arteries.Matlab Instructions: First, enter the data and relevant equations into Matlab. *Tip: it might be easier to put the respective data set into just one matrix with multiple rowsfcolumns; for example: combine the E-values in a nx2 or 2xn matrix). Next, set each of the coefficient values (A, B, C, etc.) as units of one matrix, so that when solving, it outputs one large matrix with all the coefficients included. *Note: make sure that you double check that dimensions to avoid an error. In order to utilize the Levenberg-Marquardt algorithm in Matlab, use the following: options = cplimoptionsn:'lsqcurvet'.'Algorithm','levenberg-marquardt'); Solve for the coefficients using lsqcurvet. You may then use Excel, or Matlab, to calculate and plot the respective theoretical vs. experimental data sets for $39 and $22. Lastly, solve for the correlation coefficients comparing theoretical vs. experimental $3,; and $22
Step by Step Solution
There are 3 Steps involved in it

Get step-by-step solutions from verified subject matter experts