

Question: Use a dot plot to display the data, which represent the systolic blood pressures (in millimeters of mercury) of 24 patients at a doctor's
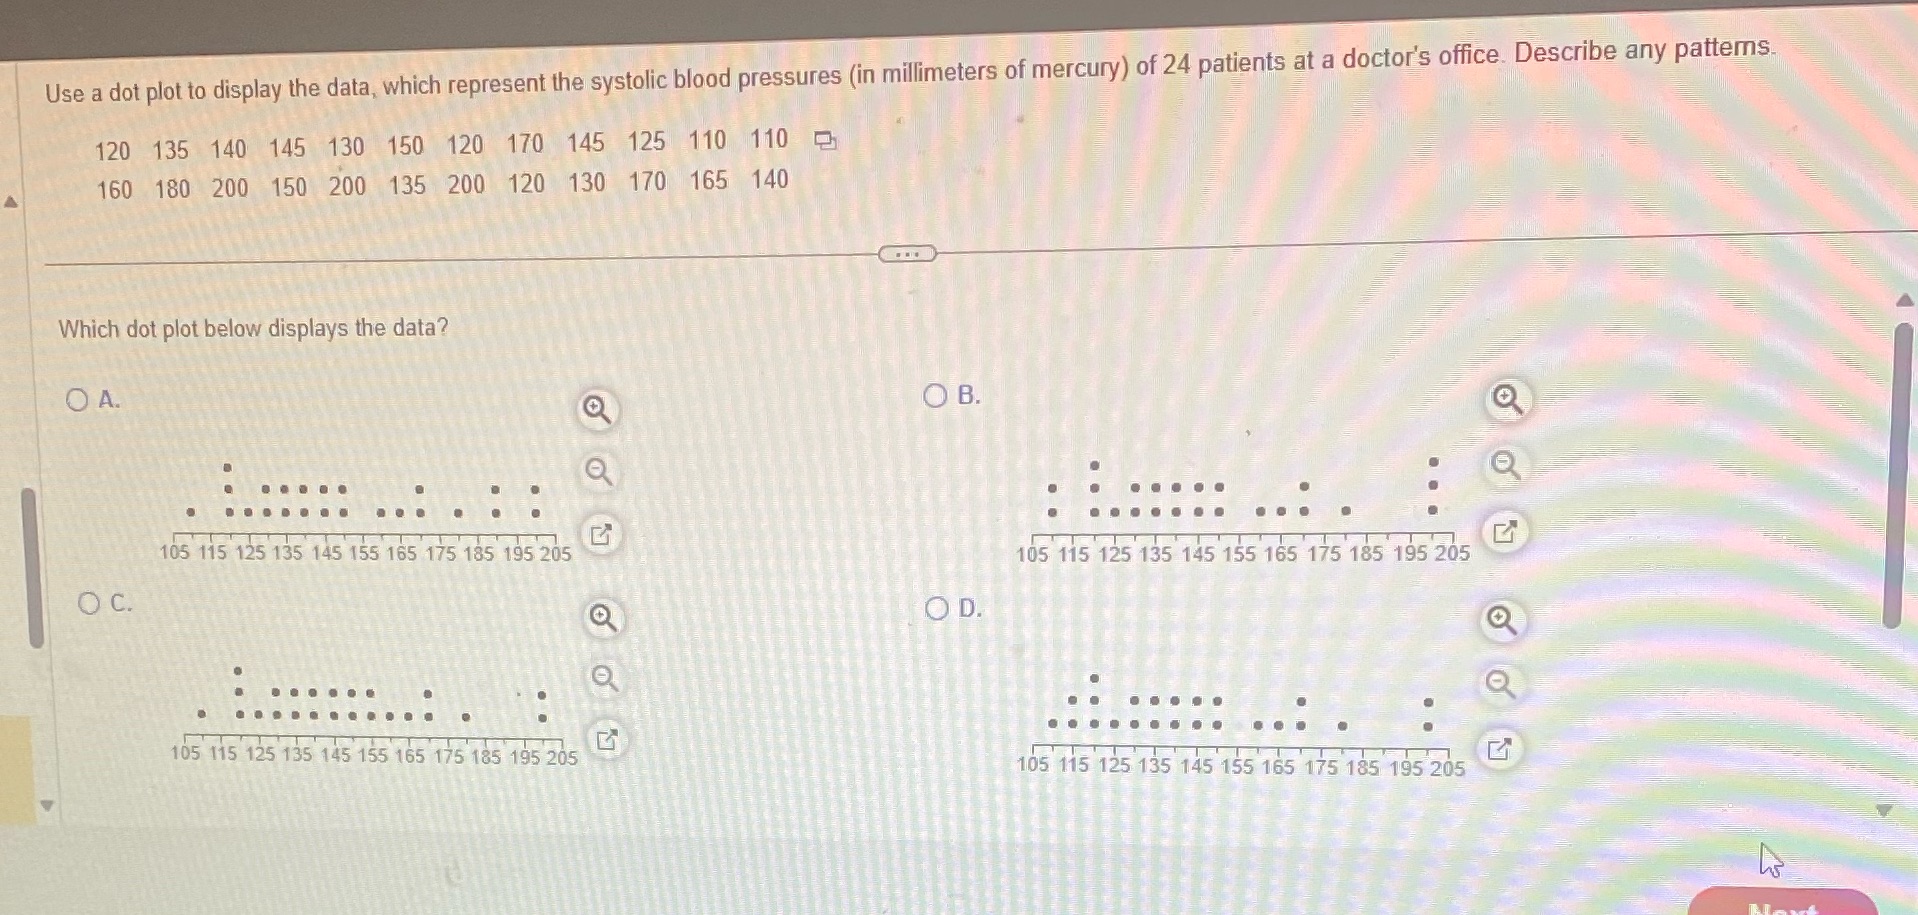
Use a dot plot to display the data, which represent the systolic blood pressures (in millimeters of mercury) of 24 patients at a doctor's office. Describe any patterns. 120 135 140 145 130 150 120 170 145 125 110 110 160 180 200 150 200 135 200 120 130 170 165 140 Which dot plot below displays the data? OA. O o Q OB. G 105 115 125 135 145 155 165 175 185 195 205 C. 105 115 125 135 145 155 165 175 185 195 205 Q O D. 105 115 125 135 145 155 165 175 185 195 205 105 115 125 135 145 155 165 175 185 195 205 O
Step by Step Solution
There are 3 Steps involved in it
1 Expert Approved Answer
Step: 1 Unlock

Question Has Been Solved by an Expert!
Get step-by-step solutions from verified subject matter experts
Step: 2 Unlock
Step: 3 Unlock