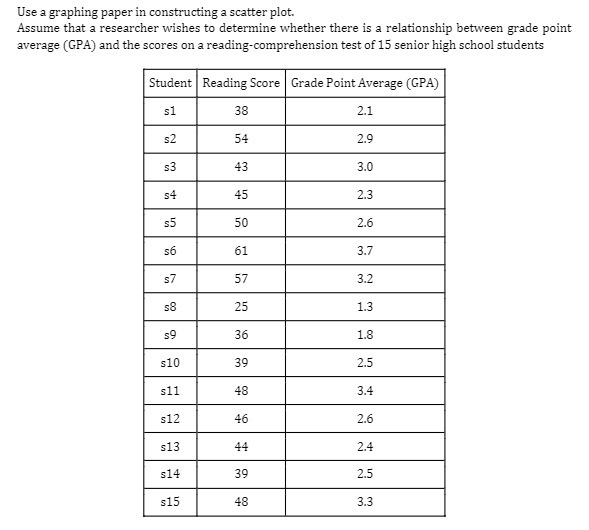
Question: Use a graphing paper in constructing a scatter plot. Assume that a researcher wishes to determine whether there is a relationship between grade point average

Use a graphing paper in constructing a scatter
Use a graphing paper in constructing a scatter plot. Assume that a researcher wishes to determine whether there is a relationship between grade point average (GPA) and the scores on a reading-comprehension test of 15 senior high school students Student Reading Score | Grade Point Average (GPA) $1 38 2.1 $2 54 2.9 43 3.0 54 45 2.3 50 2.6 56 61 3.7 57 3.2 58 25 1.3 59 36 1.8 $10 39 2.5 $11 48 3.4 $12 46 2.6 $13 44 2.4 $14 39 2.5 $15 48 3.3

Step by Step Solution

There are 3 Steps involved in it

1 Expert Approved Answer
Step: 1 Unlock blur-text-image
Question Has Been Solved by an Expert!

Get step-by-step solutions from verified subject matter experts

Step: 2 Unlock
Step: 3 Unlock

Students Have Also Explored These Related Mathematics Questions!