

Question: Use a Java program to draw a chart showing the runtime efficiency of a recursive Fibonacci function vs an iterative Fibonacci function. Please use nanosecond:
Use a Java program to draw a chart showing the runtime efficiency of a recursive Fibonacci function vs an iterative Fibonacci function.
Please use nanosecond: long startTime = System.nanoTime();
* Ask is to create a chart of the results, with time on the Y axis, and input on the X axis Creating line chart and title: LineChart linechart = new LineChart(xAxis,yAxis);
Example: 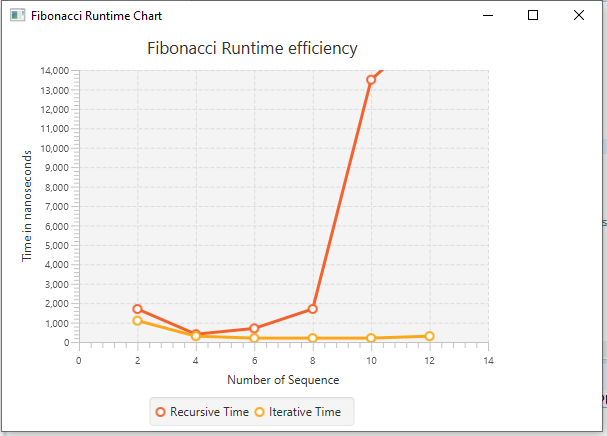
- Fibonacci Runtime Chart Fibonacci Runtime efficiency 14,000 13,000 12,000 11,000 10,000 9,000 lime in nanoseconds 8,000 7,000 6,000 5,000 4,000 3,000 2,000 1,000 0 0 2 6 8 10 12 14 Number of Sequence O Recursive Time O Iterative Time - Fibonacci Runtime Chart Fibonacci Runtime efficiency 14,000 13,000 12,000 11,000 10,000 9,000 lime in nanoseconds 8,000 7,000 6,000 5,000 4,000 3,000 2,000 1,000 0 0 2 6 8 10 12 14 Number of Sequence O Recursive Time O Iterative Time
Step by Step Solution
There are 3 Steps involved in it

Get step-by-step solutions from verified subject matter experts