

Question: Use a PivotTable to construct a frequency distribution and histogram of lunch sales amounts for the data provided. Ea8 Click the icon to view the
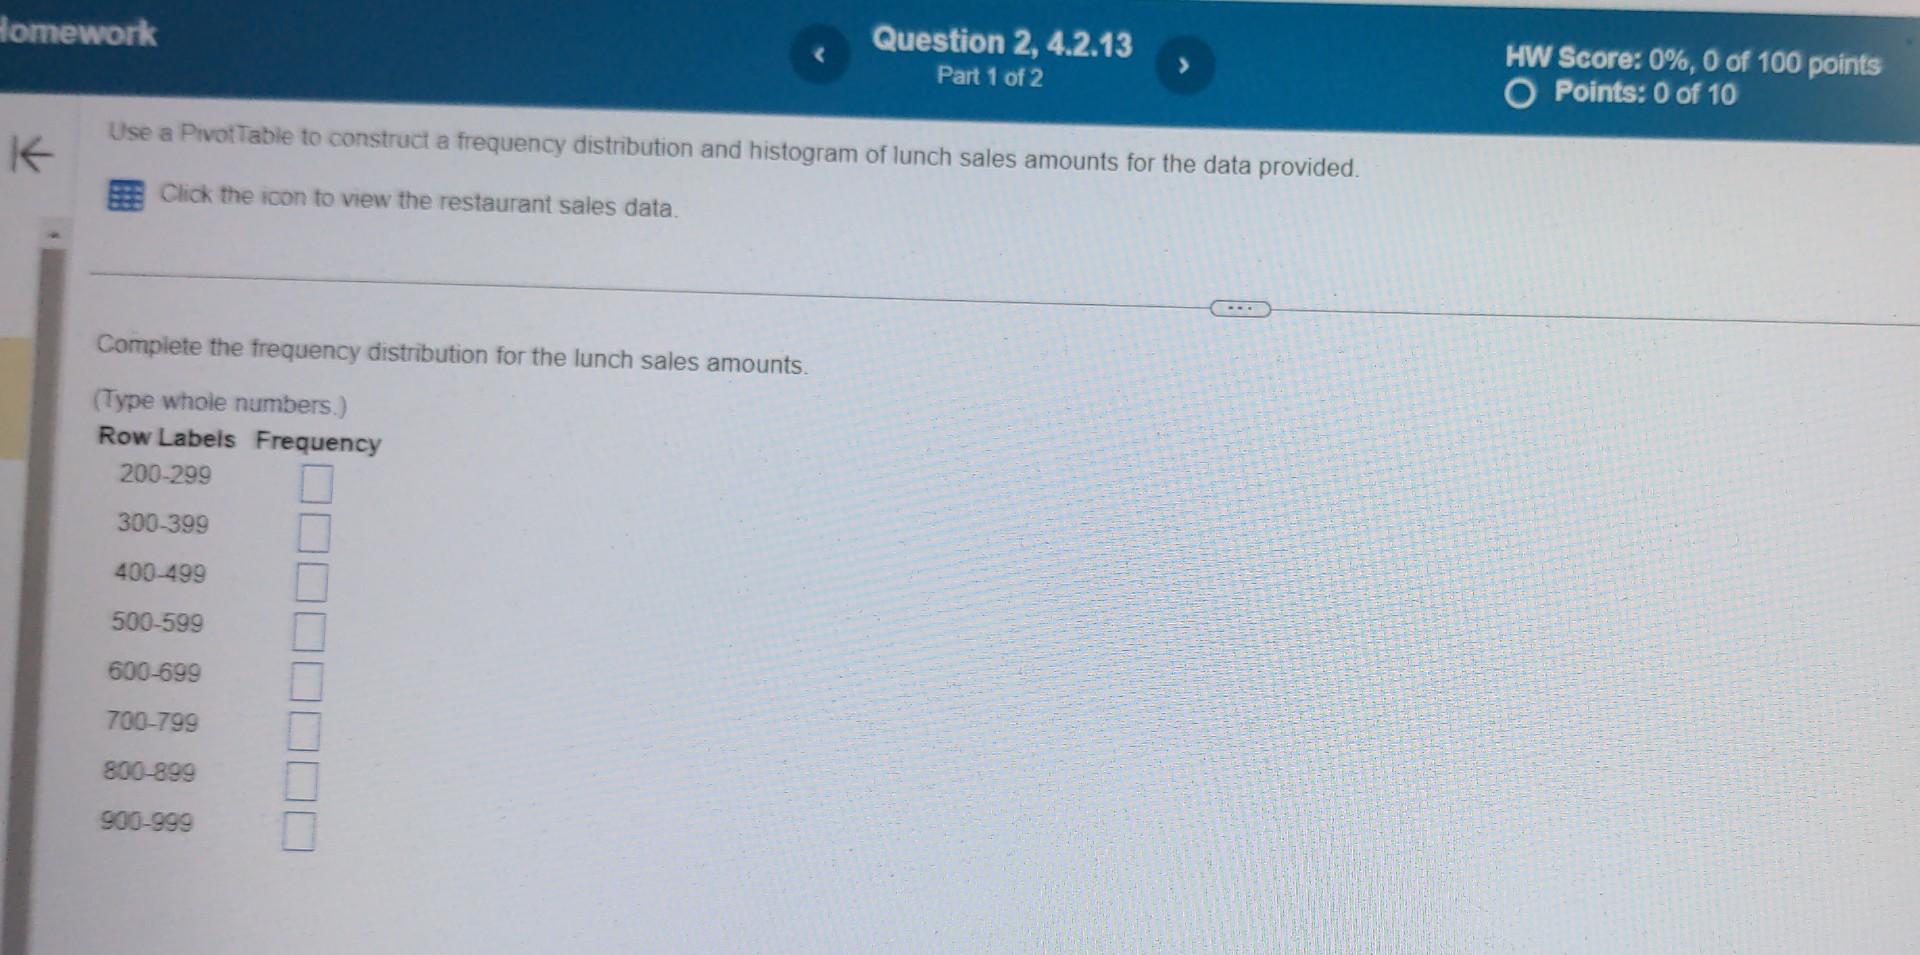
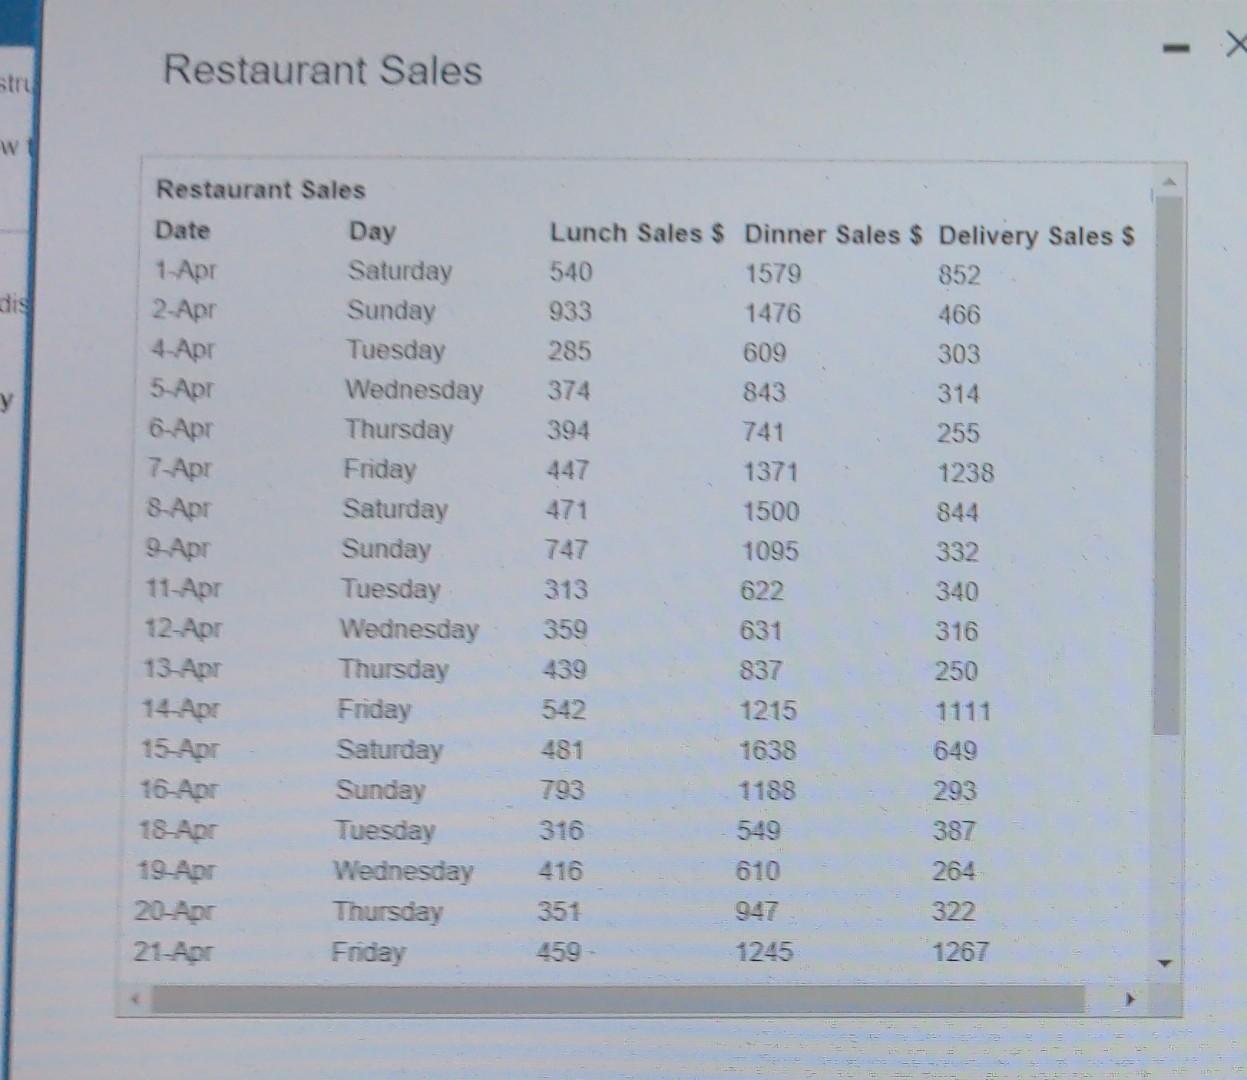
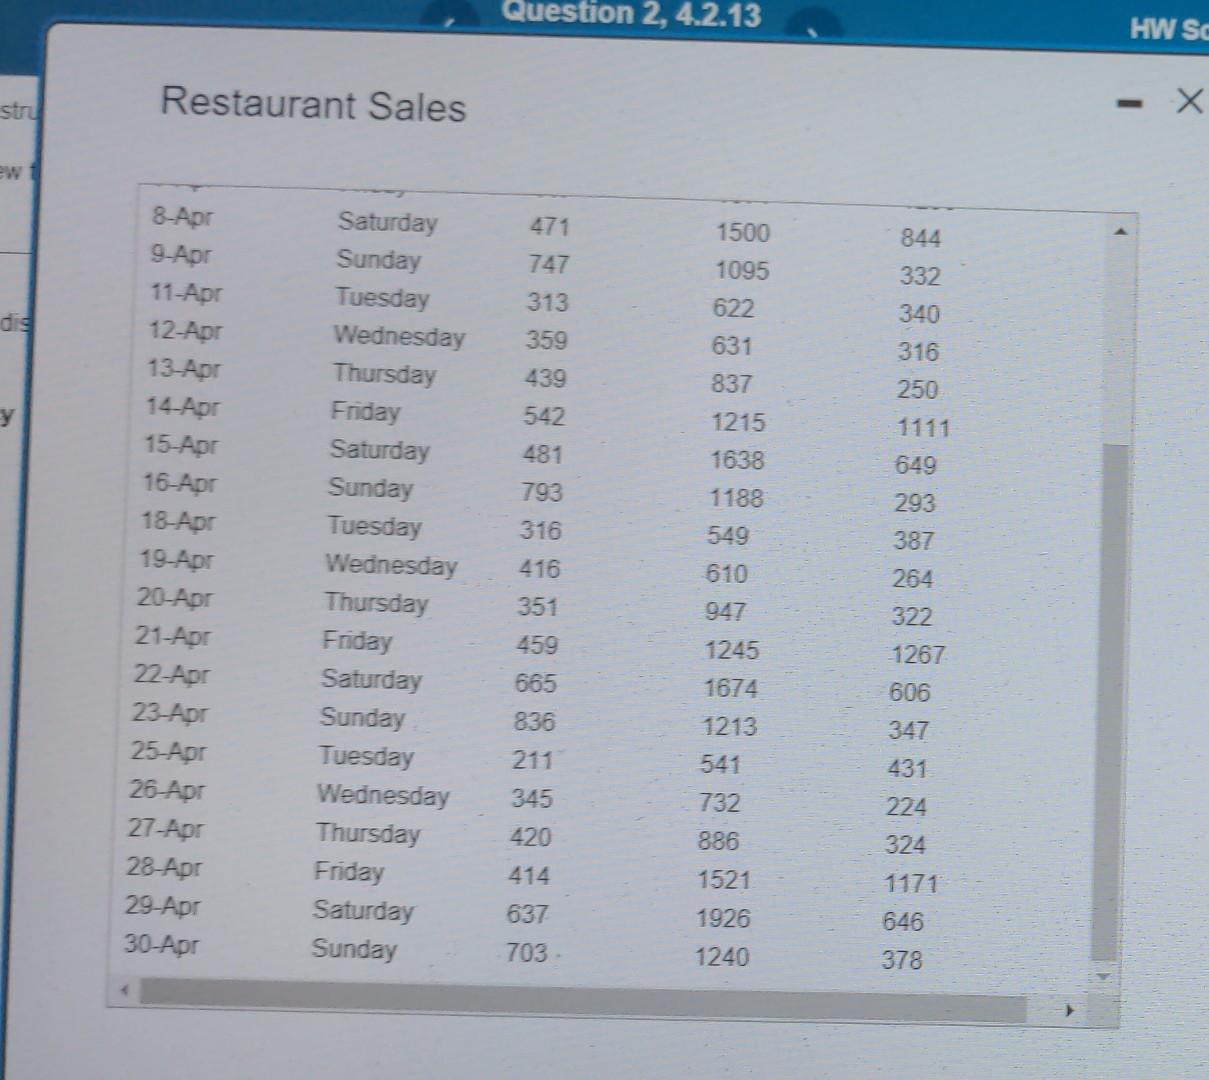
Use a PivotTable to construct a frequency distribution and histogram of lunch sales amounts for the data provided. Ea8 Click the icon to view the restaurant sales data. Complete the frequency distribution for the lunch sales amounts. Restaurant Sales Restaurant Sales
Step by Step Solution
There are 3 Steps involved in it
1 Expert Approved Answer
Step: 1 Unlock

Question Has Been Solved by an Expert!
Get step-by-step solutions from verified subject matter experts
Step: 2 Unlock
Step: 3 Unlock