

Question: Use a sensitivity analysis to illustrate how much the NPV varies for reasonable changes of the key driver inputs. (Clearly explain your sensitivity analysis process.
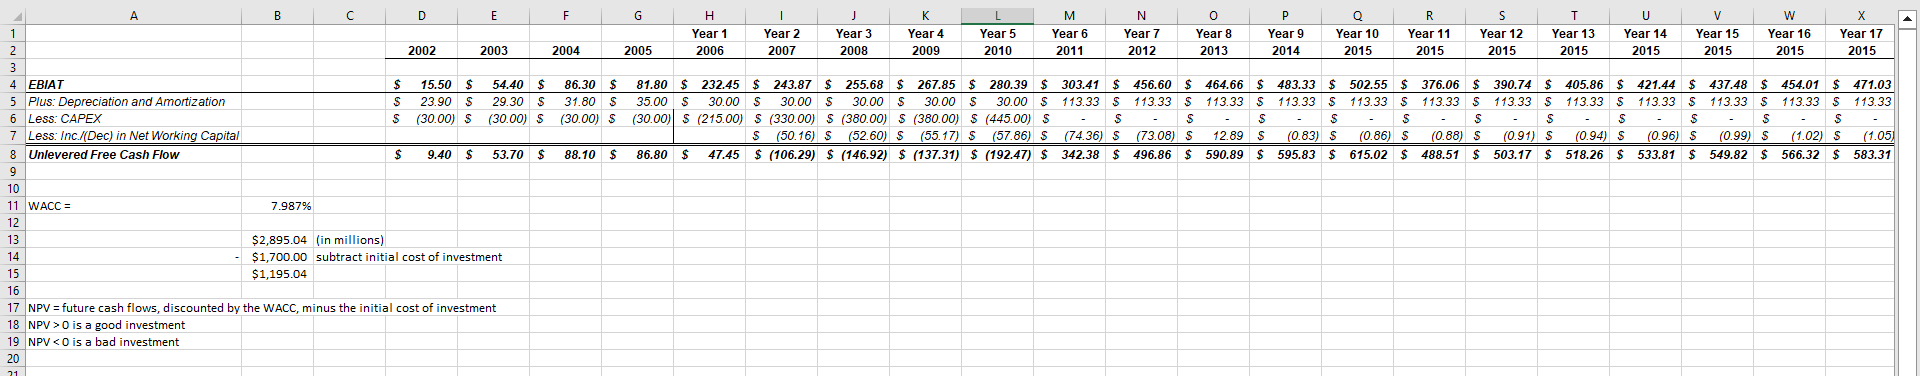
Use a sensitivity analysis to illustrate how much the NPV varies for reasonable changes of the key driver inputs. (Clearly explain your sensitivity analysis process. Which inputs did you change and why?)
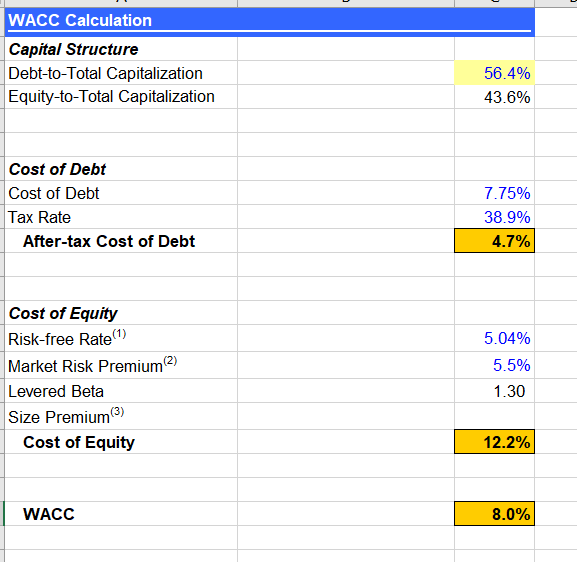
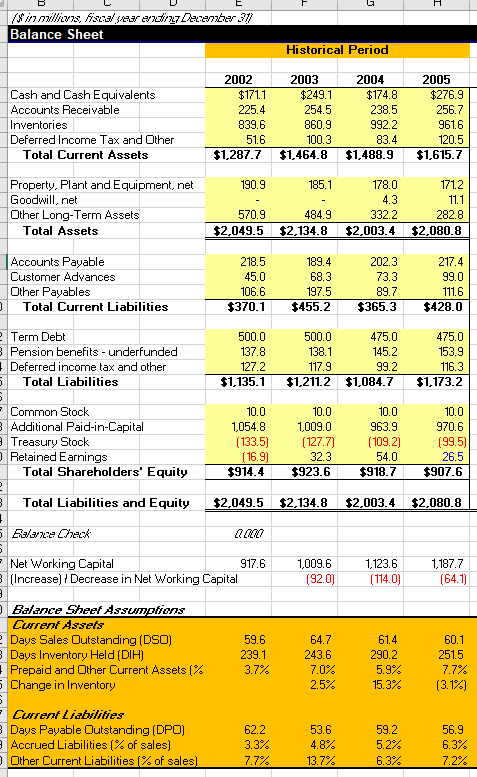
WACC Calculation Capital Structure Debt-to-Total Capitalization Equity-to-Total Capitalization 56.4% 43.6% Cost of Debt Cost of Debt Tax Rate After-tax Cost of Debt \begin{tabular}{|r|} \hline 38.9% \\ \hline 4.7% \\ \hline \end{tabular} Cost of Equity Risk-free Rate (1) Market Risk Premium (2) Levered Beta Size Premium (3) Cost of Equity 12.2% WACC 8.0% Balance Sheet Cash and Cash Equivalents Accounts Receivable Inventories Deferred Income Tax and Qther \begin{tabular}{|c|r|r|r|} \hline 2002 & \multicolumn{1}{c}{2003} & \multicolumn{1}{c|}{2004} & \multicolumn{1}{c|}{2005} \\ \hline$171.1 & $249.1 & $174.8 & $276.9 \\ 225.4 & 254.5 & 238.5 & 256.7 \\ 839.6 & 860.9 & 992.2 & 961.6 \\ 51.6 & 100.3 & 83.4 & 120.5 \\ \hline $1,287.7 & $1,464.8 & $1,488.9 & $1,615.7 \\ \hline \end{tabular} Property. Plant and Equipment, net Goodwill, net Dther Long-Term Assets Total Assets Accounts Payable Customer Advances Dther Payables \begin{tabular}{|r|r|r|r|} \hline 218.5 & 189.4 & 202.3 & 217.4 \\ 45.0 & 68.3 & 73.3 & 99.0 \\ 106.6 & 197.5 & 89.7 & 111.6 \\ \hline $370.1 & $455.2 & $365.3 & $428.0 \\ \hline 500.0 & & & \\ 137.8 & 138.0 & 475.0 & 475.0 \\ 127.2 & 117.9 & 145.2 & 153.9 \\ \hline $1,135.1 & $1,211.2 & $1,084.7 & $1,173.2 \\ \hline 10.0 & & & \\ \hline 1,054.8 & 1,009.0 & 963.9 & 970.6 \\ {[133.5]} & {[127.7]} & {[109.2]} & {[99.5]} \\ \hline[16.9] & 32.3 & 54.0 & 26.5 \\ \hline $914.4 & $923.6 & $918.7 & $907.6 \\ \hline & & & \\ \hline $2.049.5 & $2,134.8 & $2,003.4 & $2.080.8 \\ \hline \hline \end{tabular} aah Net Working Capital (Increase) i Decrease in Net Working Capital \begin{tabular}{|r|r|r|r|} \hline 917.6 & 1,009.6 & 1,123.6 & 1,187.7 \\ \hline & {[92.0]} & {[114.0]} & {[64.1]} \\ \hline \end{tabular} Bulunce Sheef stssumptions Curent dssefs Days Sales Dutstanding (DSD) Days Inventory Held (DIH) Prepaid and Dther Current Assets [\% Change in Inventory Currentiabikies Days Payable Qutstanding (DPQ) Accrued Liabilities [\% of sales] Dther Current Liabilities [\% of sales] \begin{tabular}{llll} 62.2 & 53.6 & 59.2 & 56.9 \\ 3.3% & 4.8% & 5.2% & 6.3% \\ 7.7% & 13.7% & 6.3% & 7.2% \\ \hline \end{tabular} WACC Calculation Capital Structure Debt-to-Total Capitalization Equity-to-Total Capitalization 56.4% 43.6% Cost of Debt Cost of Debt Tax Rate After-tax Cost of Debt \begin{tabular}{|r|} \hline 38.9% \\ \hline 4.7% \\ \hline \end{tabular} Cost of Equity Risk-free Rate (1) Market Risk Premium (2) Levered Beta Size Premium (3) Cost of Equity 12.2% WACC 8.0% Balance Sheet Cash and Cash Equivalents Accounts Receivable Inventories Deferred Income Tax and Qther \begin{tabular}{|c|r|r|r|} \hline 2002 & \multicolumn{1}{c}{2003} & \multicolumn{1}{c|}{2004} & \multicolumn{1}{c|}{2005} \\ \hline$171.1 & $249.1 & $174.8 & $276.9 \\ 225.4 & 254.5 & 238.5 & 256.7 \\ 839.6 & 860.9 & 992.2 & 961.6 \\ 51.6 & 100.3 & 83.4 & 120.5 \\ \hline $1,287.7 & $1,464.8 & $1,488.9 & $1,615.7 \\ \hline \end{tabular} Property. Plant and Equipment, net Goodwill, net Dther Long-Term Assets Total Assets Accounts Payable Customer Advances Dther Payables \begin{tabular}{|r|r|r|r|} \hline 218.5 & 189.4 & 202.3 & 217.4 \\ 45.0 & 68.3 & 73.3 & 99.0 \\ 106.6 & 197.5 & 89.7 & 111.6 \\ \hline $370.1 & $455.2 & $365.3 & $428.0 \\ \hline 500.0 & & & \\ 137.8 & 138.0 & 475.0 & 475.0 \\ 127.2 & 117.9 & 145.2 & 153.9 \\ \hline $1,135.1 & $1,211.2 & $1,084.7 & $1,173.2 \\ \hline 10.0 & & & \\ \hline 1,054.8 & 1,009.0 & 963.9 & 970.6 \\ {[133.5]} & {[127.7]} & {[109.2]} & {[99.5]} \\ \hline[16.9] & 32.3 & 54.0 & 26.5 \\ \hline $914.4 & $923.6 & $918.7 & $907.6 \\ \hline & & & \\ \hline $2.049.5 & $2,134.8 & $2,003.4 & $2.080.8 \\ \hline \hline \end{tabular} aah Net Working Capital (Increase) i Decrease in Net Working Capital \begin{tabular}{|r|r|r|r|} \hline 917.6 & 1,009.6 & 1,123.6 & 1,187.7 \\ \hline & {[92.0]} & {[114.0]} & {[64.1]} \\ \hline \end{tabular} Bulunce Sheef stssumptions Curent dssefs Days Sales Dutstanding (DSD) Days Inventory Held (DIH) Prepaid and Dther Current Assets [\% Change in Inventory Currentiabikies Days Payable Qutstanding (DPQ) Accrued Liabilities [\% of sales] Dther Current Liabilities [\% of sales] \begin{tabular}{llll} 62.2 & 53.6 & 59.2 & 56.9 \\ 3.3% & 4.8% & 5.2% & 6.3% \\ 7.7% & 13.7% & 6.3% & 7.2% \\ \hline \end{tabular}
Step by Step Solution
There are 3 Steps involved in it

Get step-by-step solutions from verified subject matter experts