

Question: Use Any Program to graph the curve, please also provide the source code. Thanks!! z(t) the amount of oxygen still required at time t, in
 Use Any Program to graph the curve, please also provide the source code. Thanks!!
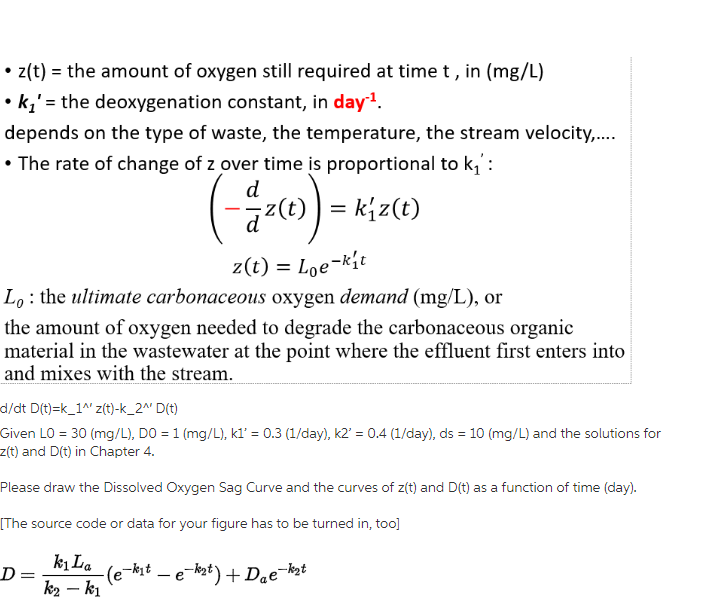
z(t) the amount of oxygen still required at time t, in (mg/L) -k' = the deoxygenation constant, in day-1. depends on the type of waste, the temperature, the stream velocity... The rate of change of z over time is proportional to k': 2(t) = Loe-kit Lo : the ultimate carbonaceous oxygen demand (mg/L), or the amount of oxygen needed to degrade the carbonaceous organic material in the wastewater at the point where the effluent first enters into and mixes with the stream d/dt D(t)=k-1^, zit)-k-2" D(t) Given LO = 30 (mg/L), DO = 1 (mg/L), k1' = 0.3 (1/day), k2' = 0.4 (1/day), ds = 10 (mg/L) and the solutions for z(t) and D(t) in Chapter 4 Please draw the Dissolved Oxygen Sag Curve and the curves of z(t) and Dit) as a function of time (day). The source code or data for your figure has to be turned in, too] 1 (e-kit-e k2- k1
Step by Step Solution
There are 3 Steps involved in it

Get step-by-step solutions from verified subject matter experts