

Question: Use appropriate descriptive statistics to summarize the following data and comment on their underlying distributions. Use cross-classification and contingency tables where useful. For quantitative data,
Use appropriate descriptive statistics to summarize the following data and comment on their underlying distributions. Use cross-classification and contingency tables where useful. For quantitative data, your presentations should entail an outlier study and results and implication for the analysis that follows. Comment on shape and skewness of the distribution. For qualitative data, your answer should include the relative frequencies. This applies to each of the following categories:
a. Experience
b. Age
c. Education
d. Salaries at time of study
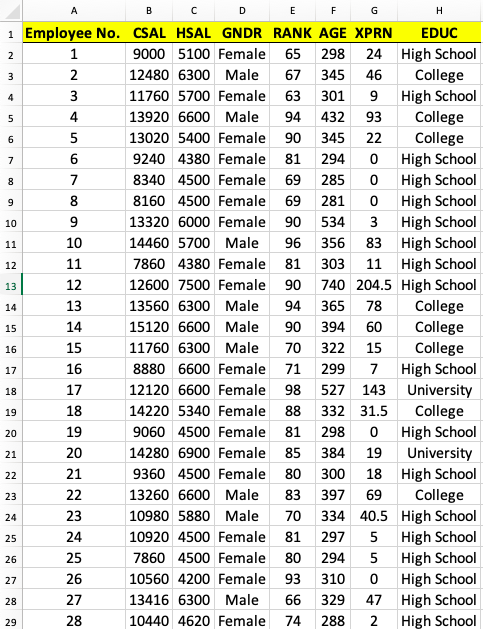
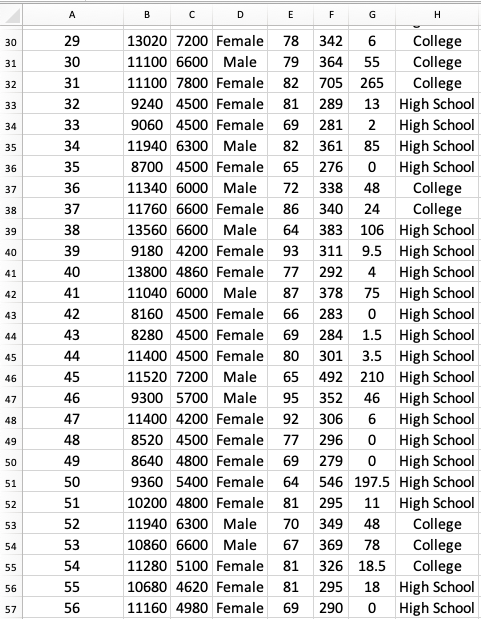
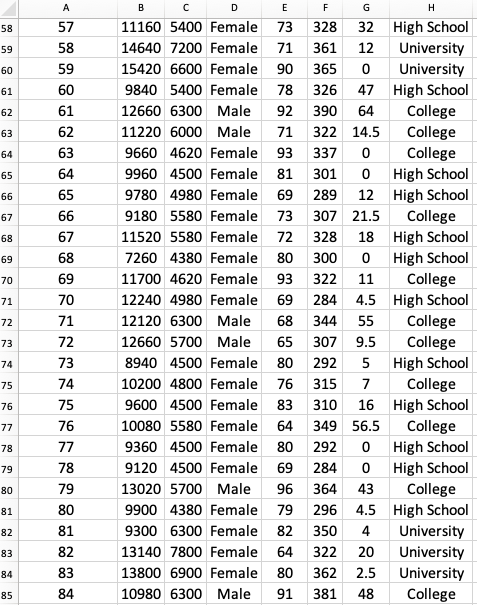
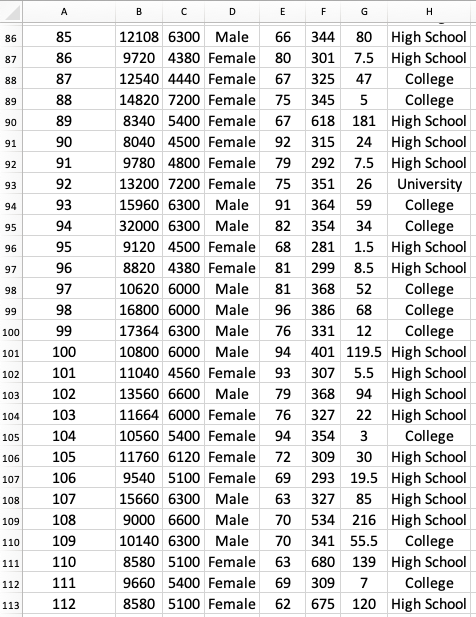
A B C D E F G H 1 Employee No. CSAL HSAL GNDR RANK AGE XPRN EDUC 2 9000 5100 Female 65 298 24 High School 3 12480 6300 Male 67 345 46 W N H College 11760 5700 Female 63 301 9 High School un 4 13920 6600 Male 94 432 93 College 5 13020 5400 Female 90 345 22 College 6 9240 4380 Female 81 294 0 High School 7 8340 4500 Female 69 285 0 High School 9 8 8160 4500 Female 69 281 0 High School 10 9 13320 6000 Female 90 534 3 High School 11 10 14460 5700 Male 96 356 83 High School 12 11 7860 4380 Female 81 303 11 High School 13 12 12600 7500 Female 90 740 204.5 High School 14 13 13560 6300 Male 94 365 78 College 15 14 15120 6600 Male 90 394 60 College 16 15 11760 6300 Male 70 322 15 College 17 16 8880 6600 Female 71 299 7 High School 18 17 12120 6600 Female 98 527 143 University 19 18 14220 5340 Female 88 332 31.5 College 20 19 9060 4500 Female 81 298 0 High School 21 20 14280 6900 Female 85 384 19 University 22 21 9360 4500 Female 80 300 18 High School 23 22 13260 6600 Male 83 397 69 College 24 23 10980 5880 Male 70 334 40.5 High School 25 24 10920 4500 Female 81 297 5 High School 26 25 7860 4500 Female 80 294 5 High School 27 26 10560 4200 Female 93 310 0 High School 28 27 13416 6300 Male 66 329 47 High School 29 28 10440 4620 Female 74 288 2 High SchoolA B C D E F G H 30 29 13020 7200 Female 78 342 6 College 31 30 11100 6600 Male 79 364 55 College 32 31 11100 7800 Female 82 705 265 College 33 32 9240 4500 Female 81 289 13 High School 34 33 9060 4500 Female 69 281 2 High School 35 34 11940 6300 Male 82 361 85 High School 36 35 8700 4500 Female 65 276 0 High School 37 36 11340 6000 Male 72 338 48 College 38 37 11760 6600 Female 86 340 24 College 39 38 13560 6600 Male 64 383 106 High School 40 39 9180 4200 Female 93 311 9.5 High School 41 40 13800 4860 Female 77 292 4 High School 42 41 11040 6000 Male 87 378 75 High School 43 42 8160 4500 Female 66 283 0 High School 44 43 8280 4500 Female 69 284 1.5 High School 45 44 11400 4500 Female 80 301 3.5 High School 46 45 11520 7200 Male 65 492 210 High School 47 46 9300 5700 Male 95 352 46 High School 48 47 11400 4200 Female 92 306 6 High School 49 48 8520 4500 Female 77 296 0 High School 50 49 8640 4800 Female 69 279 0 High School 51 50 9360 5400 Female 64 546 197.5 High School 52 51 10200 4800 Female 81 295 11 High School 53 52 11940 6300 Male 70 349 48 College 54 53 10860 6600 Male 67 369 78 College 55 54 11280 5100 Female 81 326 18.5 College 56 55 10680 4620 Female 81 295 18 High School 57 56 11160 4980 Female 69 290 0 High SchoolA B C D E F G H 58 57 11160 5400 Female 73 328 32 High School 59 58 14640 7200 Female 71 361 12 University 60 59 15420 6600 Female 90 365 0 University 61 60 9840 5400 Female 78 326 47 High School 62 61 12660 6300 Male 92 390 64 College 63 62 11220 6000 Male 71 322 14.5 College 63 9660 4620 Female 93 337 0 College 65 64 9960 4500 Female 81 301 0 High School 60 65 9780 4980 Female 69 289 12 High School 67 66 9180 5580 Female 73 307 21.5 College 68 67 11520 5580 Female 72 328 18 High School 69 68 7260 4380 Female 80 300 0 High School 70 69 11700 4620 Female 93 322 11 College 71 70 12240 4980 Female 69 284 4.5 High School 72 71 12120 6300 Male 68 344 55 College 73 72 12660 5700 Male 65 307 9.5 College 74 73 8940 4500 Female 80 292 5 High School 75 74 10200 4800 Female 76 315 7 College 76 75 9600 4500 Female 83 310 16 High School 77 76 10080 5580 Female 64 349 56.5 College 78 77 9360 4500 Female 80 292 0 High School 79 78 9120 4500 Female 69 284 0 High School BO 79 13020 5700 Male 96 364 43 College 81 80 9900 4380 Female 79 296 4.5 High School 87 81 9300 6300 Female 82 350 4 University 83 82 13140 7800 Female 64 322 20 University 84 83 13800 6900 Female 80 362 2.5 University 85 84 10980 6300 Male 91 381 48 CollegeA B C D E F G H 86 85 12108 6300 Male 66 344 80 High School 87 86 9720 4380 Female 80 301 7.5 High School 88 87 12540 4440 Female 67 325 47 College 89 88 14820 7200 Female 75 345 5 College 90 89 8340 5400 Female 67 618 181 High School 91 90 8040 4500 Female 92 315 24 High School 92 91 9780 4800 Female 79 292 7.5 High School 93 92 13200 7200 Female 75 351 26 University 94 93 15960 6300 Male 91 364 59 College 95 94 32000 6300 Male 82 354 34 College 96 95 9120 4500 Female 68 281 1.5 High School 97 96 8820 4380 Female 81 299 8.5 High School 98 97 10620 6000 Male 81 368 52 College 99 98 16800 6000 Male 96 386 68 College 100 99 17364 6300 Male 76 331 12 College 101 100 10800 6000 Male 94 401 119.5 High School 102 101 11040 4560 Female 93 307 5.5 High School 103 102 13560 6600 Male 79 368 94 High School 104 103 11664 6000 Female 76 327 22 High School 105 104 10560 5400 Female 94 354 3 College 106 105 11760 6120 Female 72 309 30 High School 107 106 9540 5100 Female 69 293 19.5 High School 108 107 15660 6300 Male 63 327 85 High School 109 108 9000 6600 Male 70 534 216 High School 110 109 10140 6300 Male 70 341 55.5 College 111 110 8580 5100 Female 63 680 139 High School 112 111 9660 5400 Female 69 309 7 College 113 112 8580 5100 Female 62 675 120 High School
Step by Step Solution
There are 3 Steps involved in it

Get step-by-step solutions from verified subject matter experts