

Question: Use astem-and-leaf plot to display the data. The data represent the heights of eruptions by a geyser. What can you conclude about thedata? IWU-National &
Use astem-and-leaf plot to display the data. The data represent the heights of eruptions by a geyser. What can you conclude about thedata?
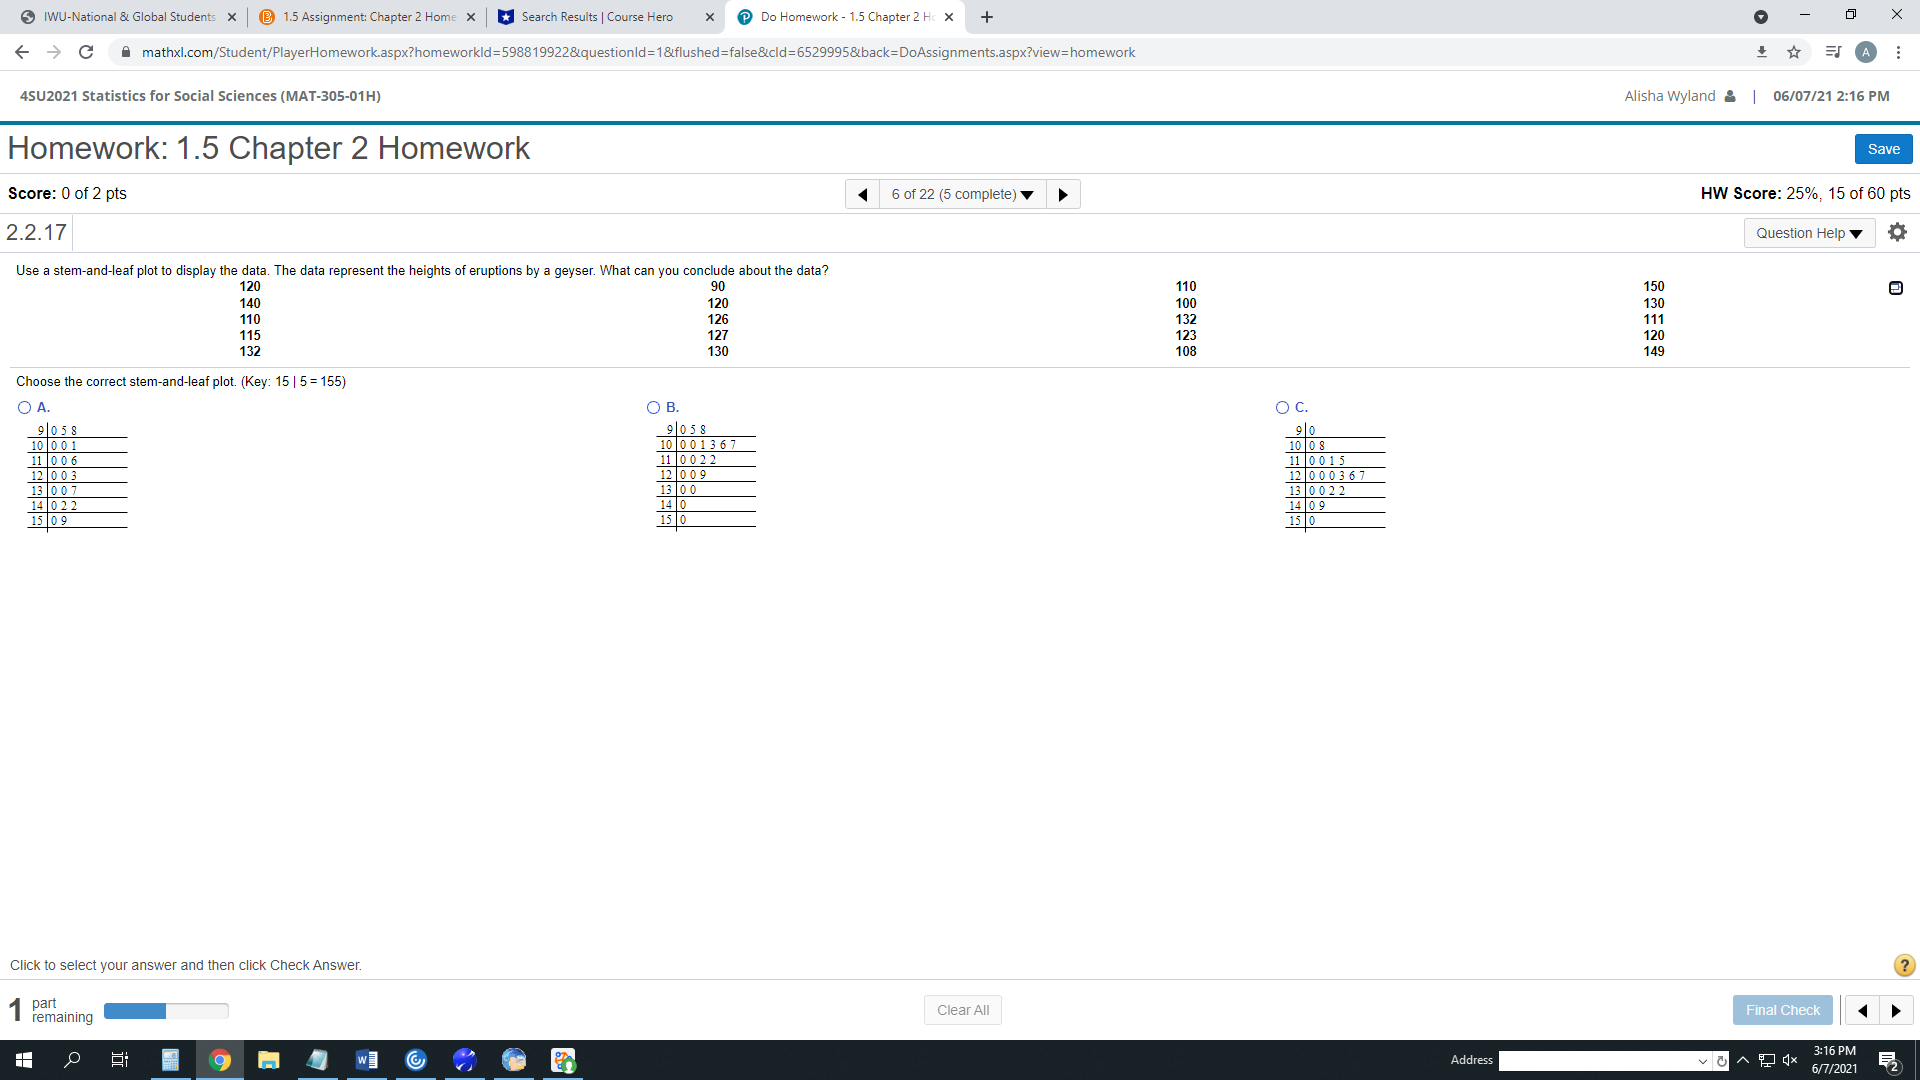
IWU-National & Global Students X @ 1.5 Assignment: Chapter 2 Home x Search Results | Course Hero * @ Do Homework - 1.5 Chapter 2 Hc X + X A mathxl.com/Student/PlayerHomework.aspx?homeworkld=598819922&questionld=1&flushed=false&cld=6529995&back=DoAssignments.aspx?view=homework 4SU2021 Statistics for Social Sciences (MAT-305-01H) Alisha Wyland & | 06/07/21 2:16 PM Homework: 1.5 Chapter 2 Homework Save Score: 0 of 2 pts 6 of 22 (5 complete) HW Score: 25%, 15 of 60 pts 2.2.17 Question Help Use a stem-and-leaf plot to display the data. The data represent the heights of eruptions by a geyser. What can you conclude about the data? 120 90 140 110 120 100 150 110 126 115 132 130 127 111 132 123 130 120 108 149 Choose the correct stem-and-leaf plot. (Key: 15 | 5 = 155) O A. O B. 9 058 OC 10 0 01 9 058 10 001367 90 11 0 06 10 0 8 12 0 0 3 11 0 02 2 12 0 09 11 0 015 13 0 07 14 02 2 13 0 0 12 000367 15 09 14 0 13 0022 15 0 14 09 15 0 Click to select your answer and then click Check Answer. part remaining Clear All Final Check 9 4 w] Address 3:16 PM 6/7/2021
Step by Step Solution
There are 3 Steps involved in it

Get step-by-step solutions from verified subject matter experts