

Question: Use C programing and gnuplot (please show code and graph) 1. By reviewing the lecture note, do the following: a. Draw a graph of sin(x)
Use C programing and gnuplot (please show code and graph)
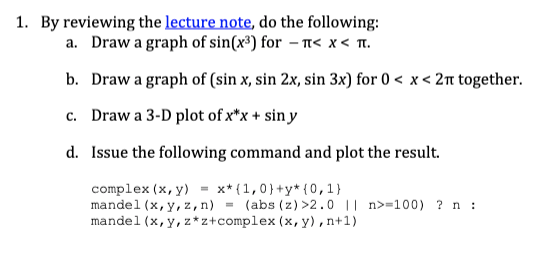
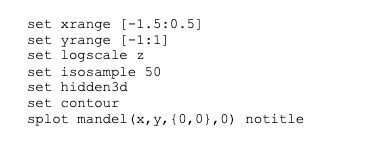
1. By reviewing the lecture note, do the following: a. Draw a graph of sin(x) for - 2.011 n>100) ?n: mandel (x, y, z*z+complex (x, y), n+1) set xrange [-1.5:0.5] set yrange [-1:1] set logscale z set isosample 50 set hidden3d set contour splot mandel (x, y, {0,0},0) notitle 1. By reviewing the lecture note, do the following: a. Draw a graph of sin(x) for - 2.011 n>100) ?n: mandel (x, y, z*z+complex (x, y), n+1) set xrange [-1.5:0.5] set yrange [-1:1] set logscale z set isosample 50 set hidden3d set contour splot mandel (x, y, {0,0},0) notitle
Step by Step Solution
There are 3 Steps involved in it
1 Expert Approved Answer
Step: 1 Unlock

Question Has Been Solved by an Expert!
Get step-by-step solutions from verified subject matter experts
Step: 2 Unlock
Step: 3 Unlock