

Question: use chart and show calculations for all ratios(for example, a number/ another number, a number-another number) , Use $283.73 as current market price. Round all
use chart and show calculations for all ratios(for example, a number/ another number, a number-another number) , Use $283.73 as current market price. Round all answers to 3 decimals.
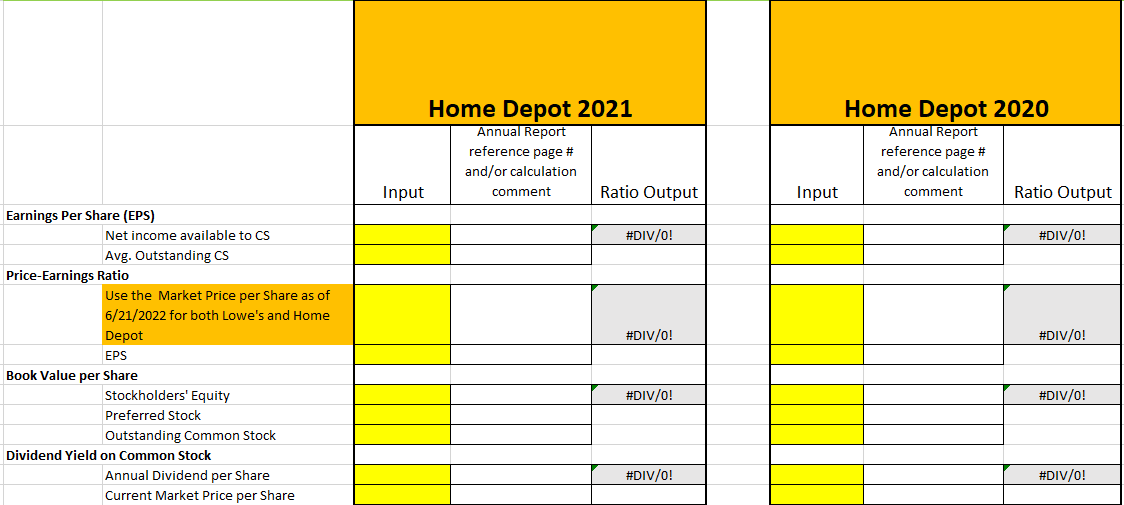
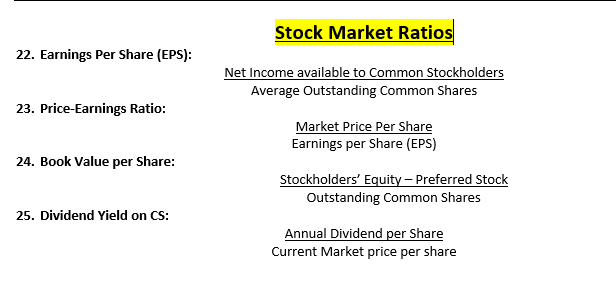
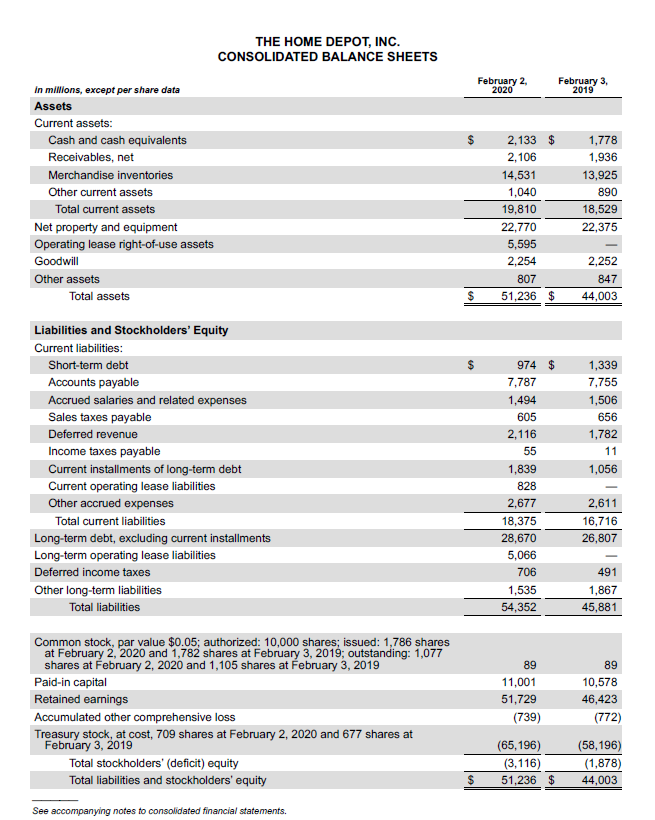
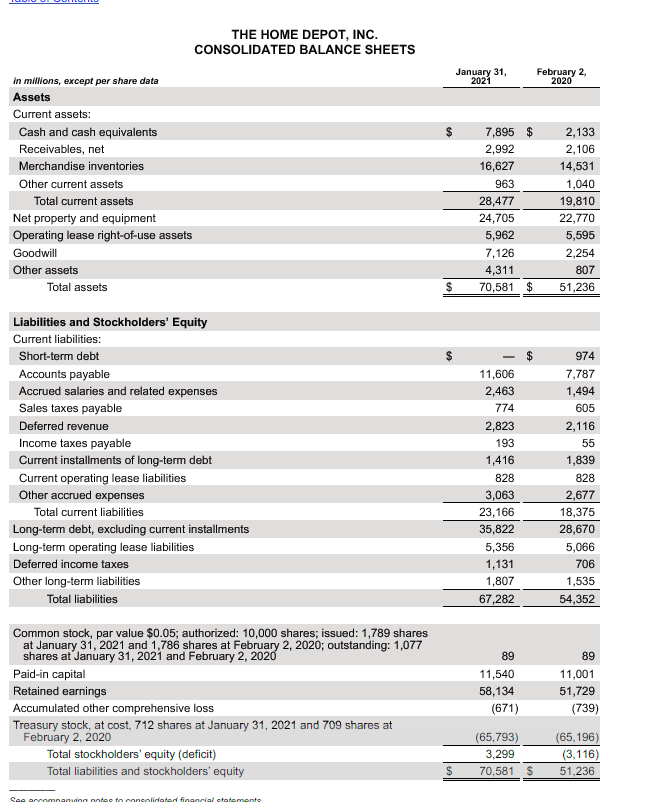
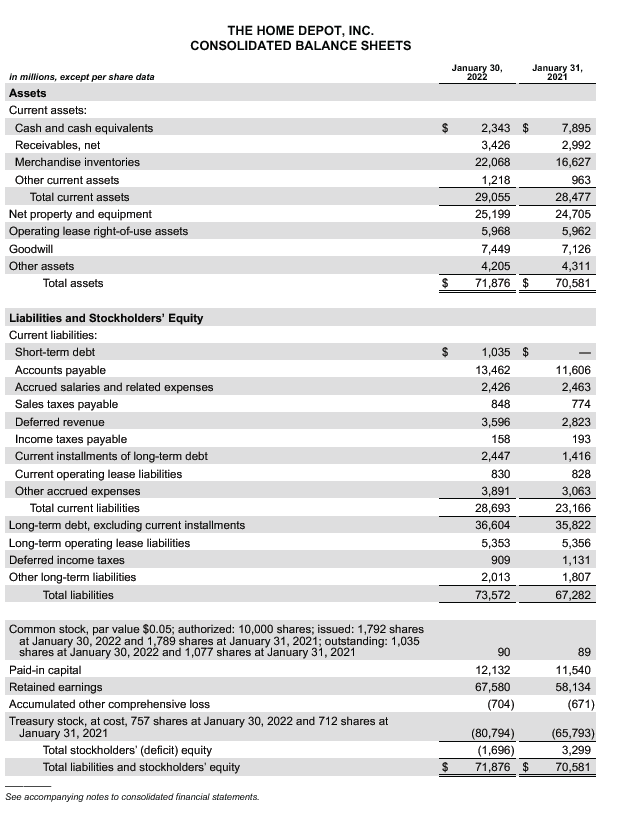
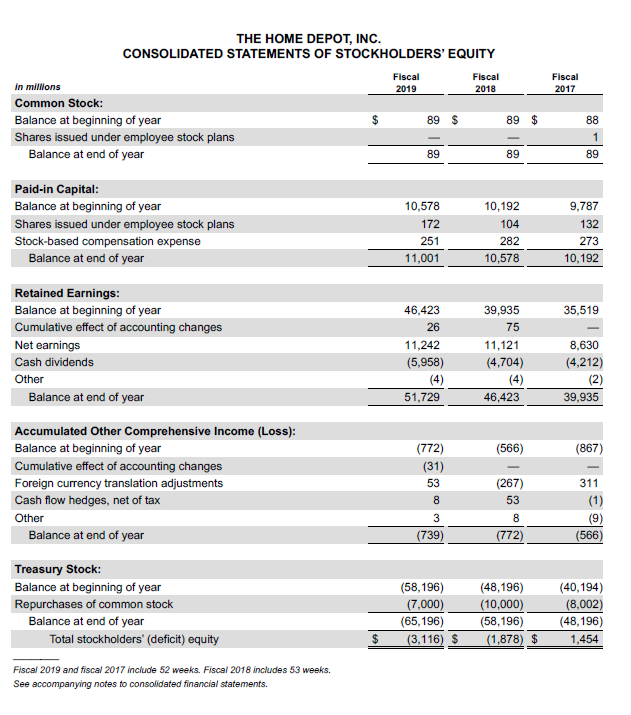
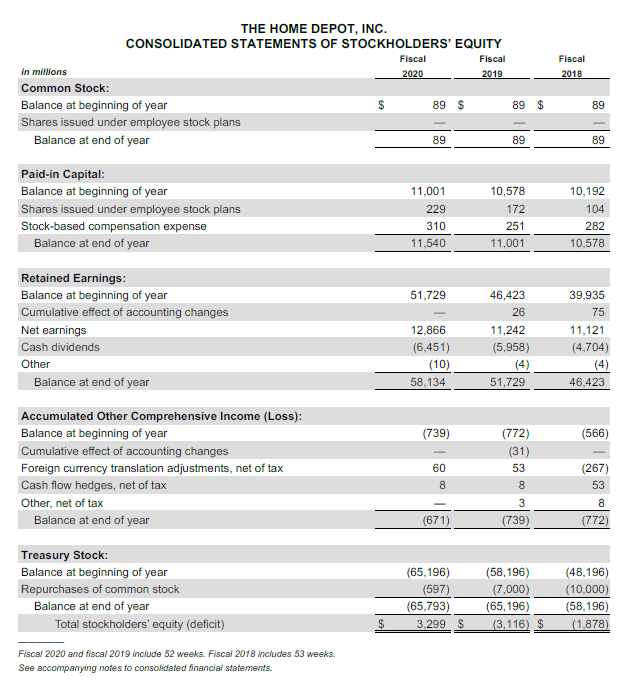
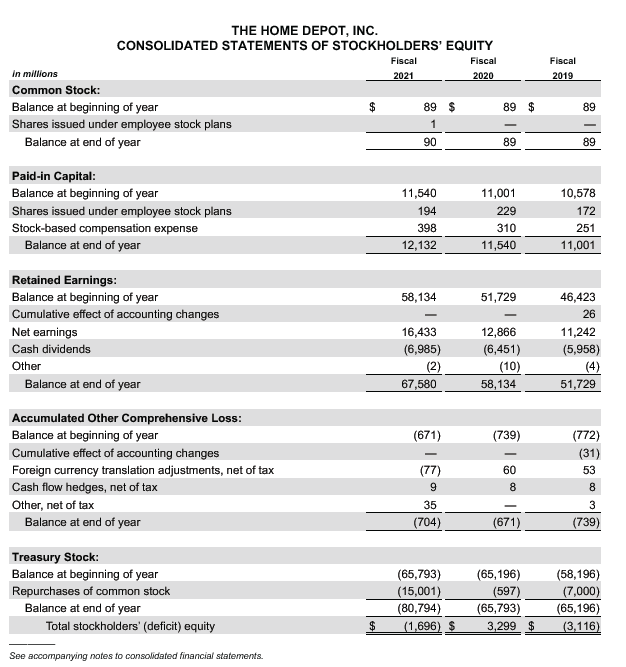
Earnings Per Share (EPS) Net income available to CS Avg. Outstanding CS Price-Earnings Ratio Use the Market Price per Share as of 6/21/2022 for both Lowe's and Home Depot EPS Book Value per Share Stockholders' Equity Preferred Stock Outstanding Common Stock Dividend Yield on Common Stock Annual Dividend per Share Current Market Price per Share Input Home Depot 2021 Annual Report reference page # and/or calculation comment Ratio Output #DIV/0! #DIV/0! #DIV/0! #DIV/0! Input Home Depot 2020 Annual Report reference page # and/or calculation comment Ratio Output #DIV/0! #DIV/0! #DIV/0! #DIV/0! 22. Earnings Per Share (EPS): 23. Price-Earnings Ratio: 24. Book Value per Share: 25. Dividend Yield on CS: Stock Market Ratios Net Income available to Common Stockholders Average Outstanding Common Shares Market Price Per Share Earnings per Share (EPS) Stockholders' Equity - Preferred Stock Outstanding Common Shares Annual Dividend per Share Current Market price per share in millions, except per share data Assets Current assets: Cash and cash equivalents Receivables, net Merchandise inventories Other current assets Total current assets Net property and equipment Operating lease right-of-use assets Goodwill Other assets Total assets THE HOME DEPOT, INC. CONSOLIDATED BALANCE SHEETS Liabilities and Stockholders' Equity Current liabilities: Short-term debt Accounts payable Accrued salaries and related expenses Sales taxes payable Deferred revenue Income taxes payable Current installments of long-term debt Current operating lease liabilities Other accrued expenses Total current liabilities Long-term debt, excluding current installments Long-term operating lease liabilities Deferred income taxes Other long-term liabilities Total liabilities Common stock, par value $0.05; authorized: 10,000 shares; issued: 1,786 shares at February 2, 2020 and 1,782 shares at February 3, 2019; outstanding: 1,077 shares at February 2, 2020 and 1,105 shares at February 3, 2019 Paid-in capital Retained earnings Accumulated other comprehensive loss Treasury stock, at cost, 709 shares at February 2, 2020 and 677 shares at February 3, 2019 Total stockholders' (deficit) equity Total liabilities and stockholders' equity See accompanying notes to consolidated financial statements. $ $ $ February 2, 2020 2,133 $ 2,106 14,531 1,040 19,810 22,770 5,595 2,254 807 51,236 $ 974 $ 7,787 1,494 605 2,116 55 1,839 828 2,677 18,375 28,670 5,066 706 1,535 54,352 89 11,001 51,729 (739) February 3, 2019 1,778 1,936 13,925 890 18,529 22,375 2,252 847 44,003 1,339 7,755 1,506 656 1,782 11 1,056 2,611 16,716 26,807 491 1,867 45,881 89 10,578 46,423 (772) (65,196) (58,196) (3,116) (1,878) 51,236 $ 44,003 in millions, except per share data Assets Current assets: Cash and cash equivalents Receivables, net Merchandise inventories Other current assets Total current assets Net property and equipment Operating lease right-of-use assets Goodwill Other assets Total assets Liabilities and Stockholders' Equity Current liabilities: THE HOME DEPOT, INC. CONSOLIDATED BALANCE SHEETS Short-term debt Accounts payable Accrued salaries and related expenses Sales taxes payable Deferred revenue Income taxes payable Current installments of long-term debt Current operating lease liabilities Other accrued expenses Total current liabilities Long-term debt, excluding current installments Long-term operating lease liabilities Deferred income taxes Other long-term liabilities Total liabilities Common stock, par value $0.05; authorized: 10,000 shares; issued: 1,789 shares at January 31, 2021 and 1,786 shares at February 2, 2020; outstanding: 1,077 shares at January 31, 2021 and February 2, 2020 Paid-in capital Retained earnings Accumulated other comprehensive loss Treasury stock, at cost, 712 shares at January 31, 2021 and 709 shares at February 2, 2020 Total stockholders' equity (deficit) Total liabilities and stockholders' equity See accompanying notes to consolidated financial statements January 31, 2021 $ 7,895 $ 2,992 16,627 963 28,477 24,705 5,962 7,126 4,311 $ 70,581 $ 11,606 2,463 774 2,823 193 1,416 828 3,063 23,166 35,822 5,356 1,131 1,807 67,282 89 11,540 58,134 (671) (65,793) 3,299 70,581 $ February 2, 2020 2,133 2,106 14,531 1,040 19,810 22,770 5,595 2,254 807 51,236 974 7,787 1,494 605 2,116 55 1,839 828 2,677 18,375 28,670 5,066 706 1,535 54,352 89 11,001 51,729 (739) (65,196) (3,116) 51,236 in millions, except per share data Assets Current assets: Cash and cash equivalents Receivables, net Merchandise inventories Other current assets Total current assets Net property and equipment Operating lease right-of-use assets Goodwill Other assets Total assets THE HOME DEPOT, INC. CONSOLIDATED BALANCE SHEETS Liabilities and Stockholders' Equity Current liabilities: Short-term debt Accounts payable Accrued salaries and related expenses Sales taxes payable Deferred revenue Income taxes payable Current installments of long-term debt Current operating lease liabilities Other accrued expenses Total current liabilities Long-term debt, excluding current installments Long-term operating lease liabilities Deferred income taxes Other long-term liabilities Total liabilities Common stock, par value $0.05; authorized: 10,000 shares; issued: 1,792 shares at January 30, 2022 and 1,789 shares at January 31, 2021; outstanding: 1,035 shares at January 30, 2022 and 1,077 shares at January 31, 2021 Paid-in capital Retained earnings Accumulated other comprehensive loss Treasury stock, at cost, 757 shares at January 30, 2022 and 712 shares at January 31, 2021 Total stockholders' (deficit) equity Total liabilities and stockholders' equity See accompanying notes to consolidated financial statements. $ January 30, 2022 $ 2,343 $ 3,426 22,068 1,218 29,055 25,199 5,968 7,449 4,205 $ 71,876 $ 1,035 $ 13,462 2,426 848 3,596 158 2,447 830 3,891 28,693 36,604 5,353 909 2,013 73,572 90 12,132 67,580 (704) (80,794) (1,696) 71,876 $ January 31, 2021 7,895 2,992 16,627 963 28,477 24,705 62 7,126 4,311 70,581 11,606 2,463 774 2,823 193 1,416 828 3,063 23,166 35,822 5,356 1,131 1,807 67,282 89 11,540 58,134 (671) (65,793) 3,299 70,581 THE HOME DEPOT, INC. CONSOLIDATED STATEMENTS OF STOCKHOLDERS' EQUITY in millions Common Stock: Balance at beginning of year Shares issued under employee stock plans Balance at end of year Paid-in Capital: Balance at beginning of year Shares issued under employee stock plans Stock-based compensation expense Balance at end of year Retained Earnings: Balance at beginning of year Cumulative effect of accounting changes Net earnings Cash dividends Other Balance at end of year Accumulated Other Comprehensive Income (Loss): Balance at beginning of year Cumulative effect of accounting changes Foreign currency translation adjustments Cash flow hedges, net of tax Other Balance at end of year Treasury Stock: Balance at beginning of year Repurchases of common stock Balance at end of year Total stockholders' (deficit) equity Fiscal 2019 and fiscal 2017 include 52 weeks. Fiscal 2018 includes 53 weeks. See accompanying notes to consolidated financial statements. $ Fiscal 2019 89 $ 89 10,578 172 251 11,001 46,423 26 11,242 (5,958) (4) 51,729 (772) (31) 53 8 3 (739) (58,196) (7,000) (65,196) (3,116) S Fiscal 2018 89 $ 89 10,192 104 282 10,578 39,935 75 11,121 (4,704) 46,423 (566) (267) 53 8 (772) (48,196) (10,000) (58,196) (1,878) $ Fiscal 2017 88 1 89 9,787 132 273 10,192 35,519 8,630 (4,212) (2) 39,935 (867) 311 (1) (9) (566 (40,194) (8,002) (48,196) 1,454 THE HOME DEPOT, INC. CONSOLIDATED STATEMENTS OF STOCKHOLDERS' EQUITY in millions Common Stock: Balance at beginning of year Shares issued under employee stock plans Balance at end of year Paid-in Capital: Balance at beginning of year Shares issued under employee stock plans Stock-based compensation expense Balance at end of year Retained Earnings: Balance at beginning of year Cumulative effect of accounting changes Net earnings Cash dividends Other Balance at end of year Accumulated Other Comprehensive Income (Loss): Balance at beginning of year Cumulative effect of accounting changes Foreign currency translation adjustments, net of tax Cash flow hedges, net of tax Other, net of tax Balance at end of year Treasury Stock: Balance at beginning of year Repurchases of common stock Balance at end of year Total stockholders' equity (deficit) Fiscal 2020 and fiscal 2019 include 52 weeks. Fiscal 2018 includes 53 weeks. See accompanying notes to consolidated financial statements. Fiscal 2020 89 $ 89 11,001 229 310 11,540 51,729 12,866 (6,451) (10) 58,134 (739) 60 8 (671) (65,196) (597) (65,793) 3,299 $ Fiscal 2019 89 $ 89 10,578 172 251 11,001 46,423 26 11,242 (5,958) (4) 51,729 (772) (31) 53 8 3 (739) (58,196) (7,000) (65,196) (3,116) $ Fiscal 2018 89 89 10,192 104 282 10,578 39,935 75 11,121 (4,704) 46,423 (566) (267) 53 8 (772) (48,196) (10,000) (58,196) (1,878) THE HOME DEPOT, INC. CONSOLIDATED STATEMENTS OF STOCKHOLDERS' EQUITY in millions Common Stock: Balance at beginning of year Shares issued under employee stock plans Balance at end of year Paid-in Capital: Balance at beginning of year Shares issued under employee stock plans Stock-based compensation expense Balance at end of year Retained Earnings: Balance at beginning of year Cumulative effect of accounting changes Net earnings Cash dividends Other Balance at end of year Accumulated Other Comprehensive Loss: Balance at beginning of year Cumulative effect of accounting changes Foreign currency translation adjustments, net of tax Cash flow hedges, net of tax Other, net of tax Balance at end of year Treasury Stock: Balance at beginning of year Repurchases of common stock Balance at end of year Total stockholders' (deficit) equity See accompanying notes to consolidated financial statements. $ Fiscal 2021 89 $ 1 90 11,540 194 398 12,132 58,134 16,433 (6,985) (2) 67,580 (671) (77) 9 35 (704) (65,793) (15,001) (80,794) (1,696) $ Fiscal 2020 89 $ 89 11,001 229 310 11,540 51,729 - 12,866 (6,451) (10) 58,134 (739) 60 8 (671) (65,196) (597) (65,793) 3,299 $ Fiscal 2019 89 89 10,578 172 251 11,001 46,423 26 11,242 (5,958) 51,729 (772) (31) 53 8 3 (739) (58,196) (7,000) (65,196) (3,116)
Step by Step Solution
There are 3 Steps involved in it

Get step-by-step solutions from verified subject matter experts