

Question: use chart and show work if needed At December 31, 2018, the financial statements of Hollingsworth Industries included the following: Net income for 2018 Bonds
 use chart and show work if needed
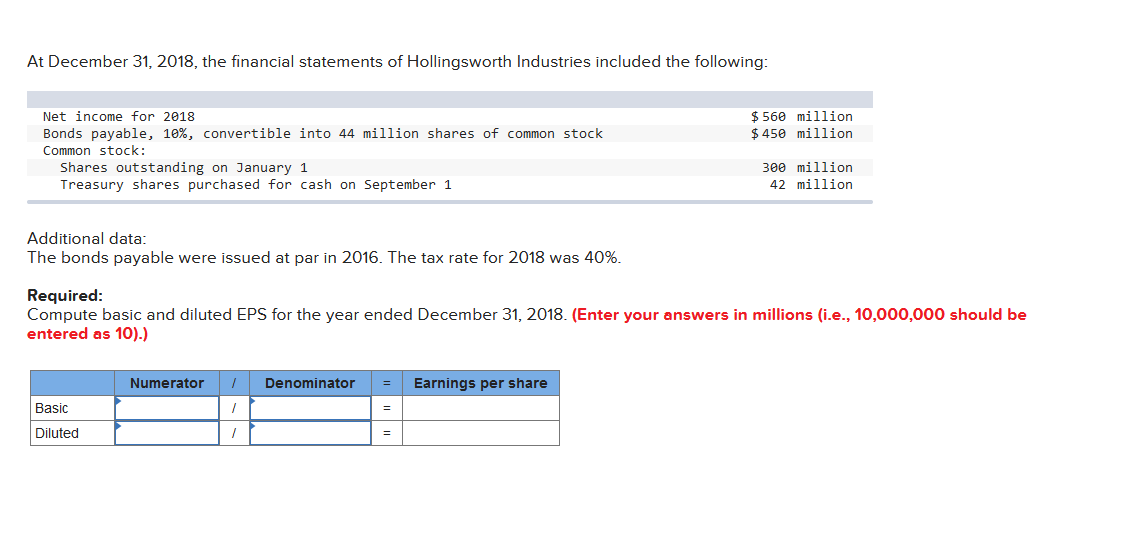
At December 31, 2018, the financial statements of Hollingsworth Industries included the following: Net income for 2018 Bonds payable, 10%, convertible into 44 million shares of common stock Common stock: Shares outstanding on January 1 Treasury shares purchased for cash on September 1 Additional data: The bonds payable were issued at par in 2016. The tax rate for 2018 was 40%. Basic Diluted Required: Compute basic and diluted EPS for the year ended December 31, 2018. (Enter your answers in millions (i.e., 10,000,000 should be entered as 10).) Numerator 1 / Denominator = = = $560 million $450 million Earnings per share 300 million 42 million
Step by Step Solution
There are 3 Steps involved in it

Get step-by-step solutions from verified subject matter experts