

Question: Use chart format, show calculation for all ratio(for example, which number divide by which number) Working Capital Current Assets Current Liabilities Current Ratio Current Assets
Use chart format, show calculation for all ratio(for example, which number divide by which number)
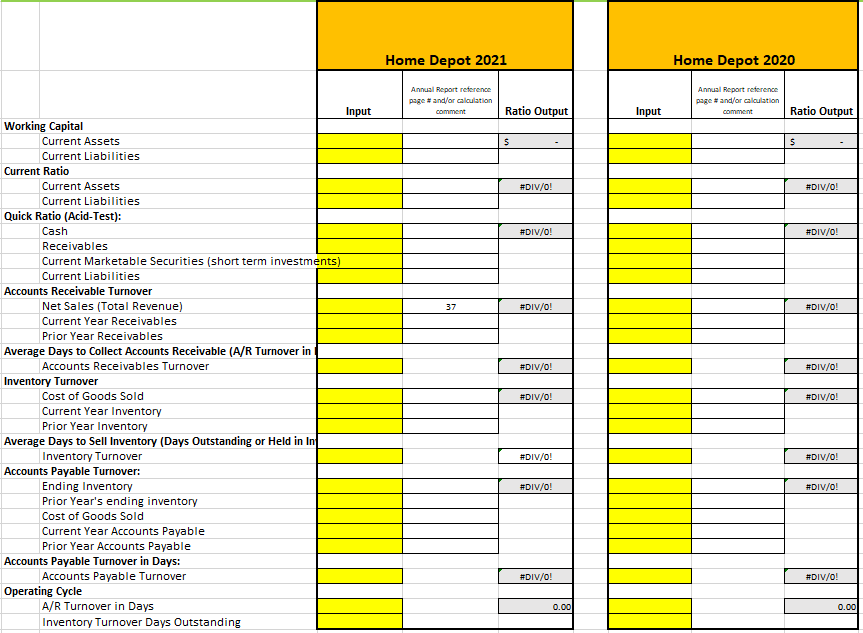
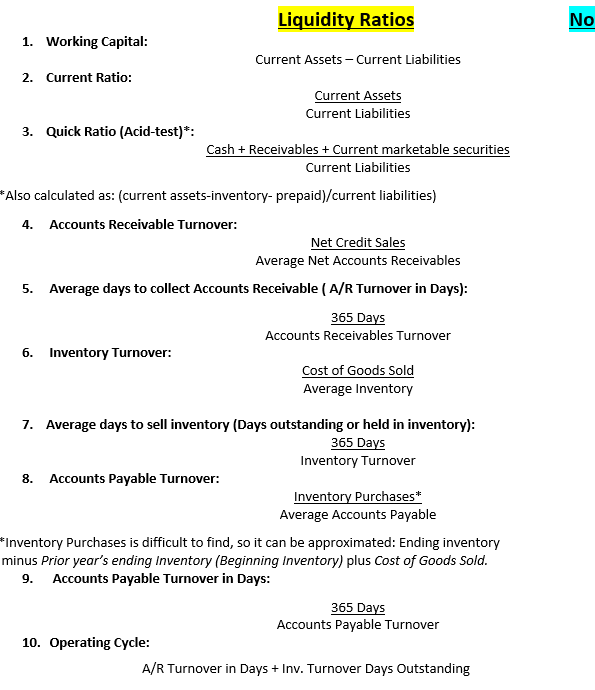
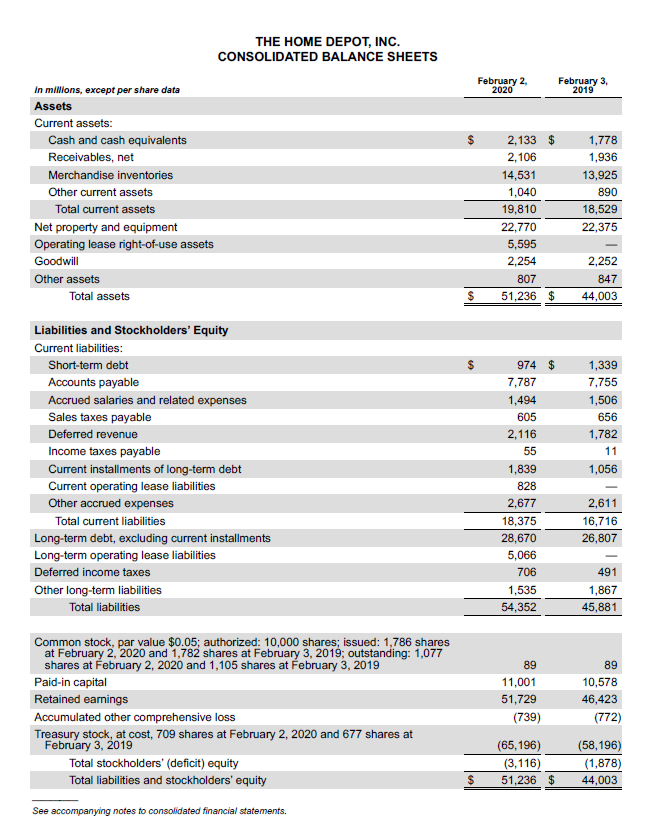
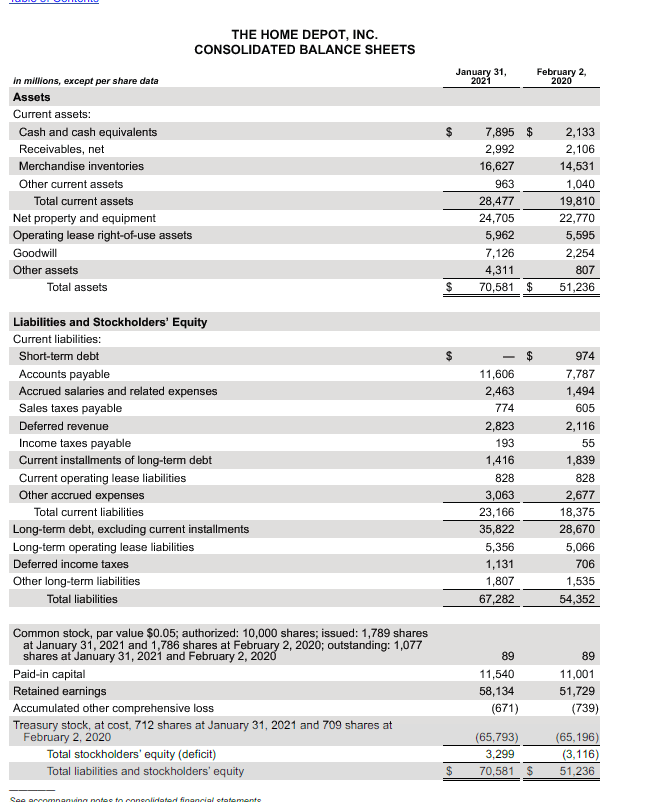
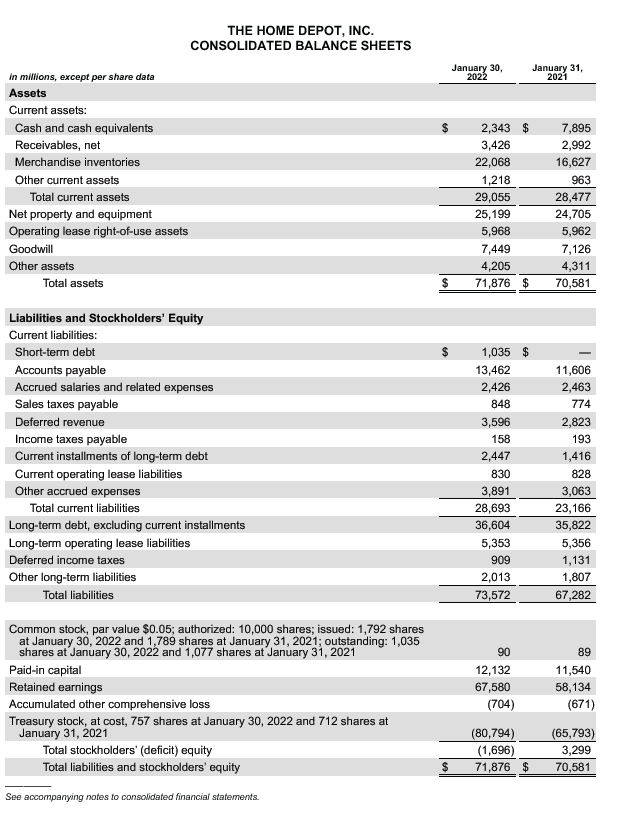
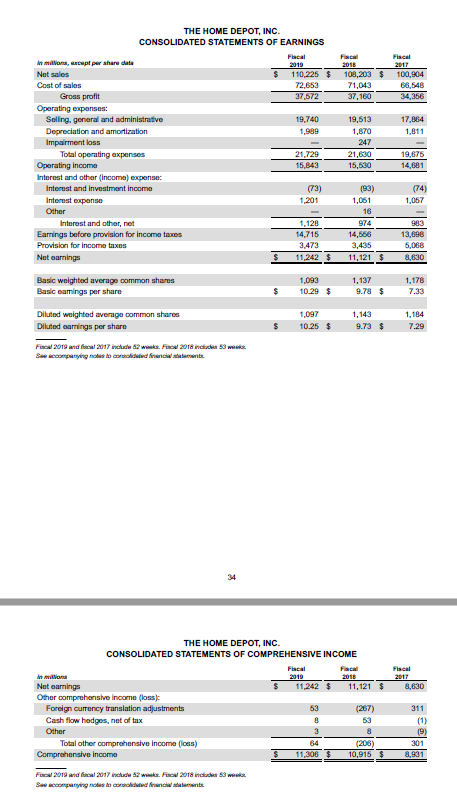
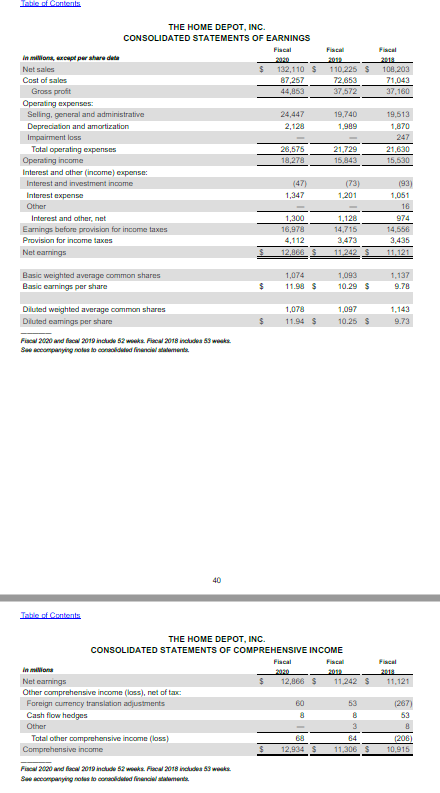
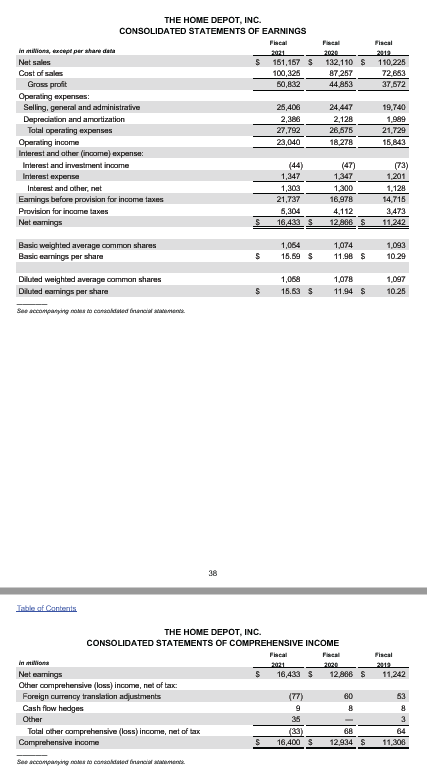
Working Capital Current Assets Current Liabilities Current Ratio Current Assets Current Liabilities Quick Ratio (Acid-Test): Cash Receivables Current Marketable Securities (short term investments) Current Liabilities Accounts Receivable Turnover Net Sales (Total Revenue) Current Year Receivables Prior Year Receivables Average Days to Collect Accounts Receivable (A/R Turnover in Accounts Receivables Turnover Inventory Turnover Cost of Goods Sold Current Year Inventory Prior Year Inventory Average Days to Sell Inventory (Days Outstanding or Held in In Inventory Turnover Accounts Payable Turnover: Ending Inventory Prior Year's ending inventory Cost of Goods Sold Current Year Accounts Payable Prior Year Accounts Payable Accounts Payable Turnover in Days: Accounts Payable Turnover Operating Cycle A/R Turnover in Days Inventory Turnover Days Outstanding Input Home Depot 2021 Annual Report reference page # and/or calculation comment 37 Ratio Output S #DIV/0! #DIV/0! #DIV/0! #DIV/0! #DIV/0! #DIV/0! #DIV/0! #DIV/0! 0.00 Input Home Depot 2020 Annual Report reference page # and/or calculation comment Ratio Output S #DIV/0! #DIV/0! #DIV/0! #DIV/0! #DIV/0! #DIV/0! #DIV/0! #DIV/0! 0.00 1. Working Capital: 2. Current Ratio: 3. Quick Ratio (Acid-test)*: *Also calculated as: (current assets-inventory- prepaid)/current liabilities) 4. Accounts Receivable Turnover: 6. Net Credit Sales Average Net Accounts Receivables 5. Average days to collect Accounts Receivable (A/R Turnover in Days): 365 Days Accounts Receivables Turnover Inventory Turnover: Liquidity Ratios Current Assets - Current Liabilities Current Assets Current Liabilities Cash + Receivables + Current marketable securities Current Liabilities 8. Accounts Payable Turnover: 7. Average days to sell inventory (Days outstanding or held in inventory): 365 Days Inventory Turnover 10. Operating Cycle: Cost of Goods Sold Average Inventory Inventory Purchases" Average Accounts Payable *Inventory Purchases is difficult to find, so it can be approximated: Ending inventory minus Prior year's ending Inventory (Beginning Inventory) plus Cost of Goods Sold. 9. Accounts Payable Turnover in Days: 365 Days Accounts Payable Turnover A/R Turnover in Days + Inv. Turnover Days Outstanding No in millions, except per share data Assets Current assets: Cash and cash equivalents Receivables, net Merchandise inventories Other current assets Total current assets Net property and equipment Operating lease right-of-use assets Goodwill Other assets Total assets THE HOME DEPOT, INC. CONSOLIDATED BALANCE SHEETS Liabilities and Stockholders' Equity Current liabilities: Short-term debt Accounts payable Accrued salaries and related expenses Sales taxes payable Deferred revenue Income taxes payable Current installments of long-term debt Current operating lease liabilities Other accrued expenses Total current liabilities Long-term debt, excluding current installments Long-term operating lease liabilities Deferred income taxes Other long-term liabilities Total liabilities Common stock, par value $0.05; authorized: 10,000 shares; issued: 1,786 shares at February 2, 2020 and 1,782 shares at February 3, 2019; outstanding: 1,077 shares at February 2, 2020 and 1,105 shares at February 3, 2019 Paid-in capital Retained earnings Accumulated other comprehensive loss Treasury stock, at cost, 709 shares at February 2, 2020 and 677 shares at February 3, 2019 Total stockholders' (deficit) equity Total liabilities and stockholders' equity See accompanying notes to consolidated financial statements. $ $ $ February 2, 2020 2,133 $ 2,106 14,531 1,040 19,810 22,770 5,595 2,254 807 51,236 $ 974 $ 7,787 1,494 605 2,116 55 1,839 828 2,677 18,375 28,670 5,066 706 1,535 54,352 89 11,001 51,729 (739) February 3, 2019 1,778 1,936 13,925 890 18,529 22,375 2,252 847 44,003 1,339 7,755 1,506 656 1,782 11 1,056 2,611 16,716 26,807 491 1,867 45,881 89 10,578 46,423 (772) (65,196) (58,196) (3,116) (1,878) 51,236 $ 44,003 in millions, except per share data Assets Current assets: Cash and cash equivalents Receivables, net Merchandise inventories Other current assets Total current assets Net property and equipment Operating lease right-of-use assets Goodwill Other assets Total assets Liabilities and Stockholders' Equity Current liabilities: THE HOME DEPOT, INC. CONSOLIDATED BALANCE SHEETS Short-term debt Accounts payable Accrued salaries and related expenses Sales taxes payable Deferred revenue Income taxes payable Current installments of long-term debt Current operating lease liabilities Other accrued expenses Total current liabilities Long-term debt, excluding current installments Long-term operating lease liabilities Deferred income taxes Other long-term liabilities Total liabilities Common stock, par value $0.05; authorized: 10,000 shares; issued: 1,789 shares at January 31, 2021 and 1,786 shares at February 2, 2020; outstanding: 1,077 shares at January 31, 2021 and February 2, 2020 Paid-in capital Retained earnings Accumulated other comprehensive loss Treasury stock, at cost, 712 shares at January 31, 2021 and 709 shares at February 2, 2020 Total stockholders' equity (deficit) Total liabilities and stockholders' equity See accompanying notes to consolidated financial statements January 31, 2021 $ 7,895 $ 2,992 16,627 963 28,477 24,705 5,962 7,126 4,311 $ 70,581 $ 11,606 2,463 774 2,823 193 1,416 828 3,063 23,166 35,822 5,356 1,131 1,807 67,282 89 11,540 58,134 (671) (65,793) 3,299 70,581 $ February 2, 2020 2,133 2,106 14,531 1,040 19,810 22,770 5,595 2,254 807 51,236 974 7,787 1,494 605 2,116 55 1,839 828 2,677 18,375 28,670 5,066 706 1,535 54,352 89 11,001 51,729 (739) (65,196) (3,116) 51,236 in millions, except per share data Assets Current assets: Cash and cash equivalents Receivables, net Merchandise inventories Other current assets Total current assets Net property and equipment Operating lease right-of-use assets Goodwill Other assets Total assets THE HOME DEPOT, INC. CONSOLIDATED BALANCE SHEETS Liabilities and Stockholders' Equity Current liabilities: Short-term debt Accounts payable Accrued salaries and related expenses Sales taxes payable Deferred revenue Income taxes payable Current installments of long-term debt Current operating lease liabilities Other accrued expenses Total current liabilities Long-term debt, excluding current installments Long-term operating lease liabilities Deferred income taxes Other long-term liabilities Total liabilities Common stock, par value $0.05; authorized: 10,000 shares; issued: 1,792 shares at January 30, 2022 and 1,789 shares at January 31, 2021; outstanding: 1,035 shares at January 30, 2022 and 1,077 shares at January 31, 2021 Paid-in capital Retained earnings Accumulated other comprehensive loss Treasury stock, at cost, 757 shares at January 30, 2022 and 712 shares at January 31, 2021 Total stockholders' (deficit) equity Total liabilities and stockholders' equity See accompanying notes to consolidated financial statements. $ January 30, 2022 $ 2,343 $ 3,426 22,068 1,218 29,055 25,199 5,968 7,449 4,205 $ 71,876 $ 1,035 $ 13,462 2,426 848 3,596 158 2,447 830 3,891 28,693 36,604 5,353 909 2,013 73,572 90 12,132 67,580 (704) (80,794) (1,696) 71,876 $ January 31, 2021 7,895 2,992 16,627 963 28,477 24,705 62 7,126 4,311 70,581 11,606 2,463 774 2,823 193 1,416 828 3,063 23,166 35,822 5,356 1,131 1,807 67,282 89 11,540 58,134 (671) (65,793) 3,299 70,581 in millions, except per share data Net sales Cost of sales Gross profit Operating expenses: Selling, general and administrative Depreciation and amortization Impairment loss Total operating expenses THE HOME DEPOT, INC. CONSOLIDATED STATEMENTS OF EARNINGS Operating income Interest and other (income) expense: Interest and investment income Interest expense Other Interest and other, net Earnings before provision for income taxes Provision for income taxes Net earnings Basic weighted average common shares Basic eamings per share Diluted weighted average common shares Diluted earnings per share Fiscal 2019 and focal 2017 include 52 weeks. Fiscal 2018 includes 53 wek Se accompanying notes to consolidated financial statements in milliona Net earnings Other comprehensive income (loss): Foreign currency translation adjustments Cash flow hedges, net of tax Other Total other comprehensive income (loss) Comprehensive income 34 Fiscal 2019 and facal 2017 include 52 weeks. Fiscal 2018 includes 53 weeks. Se accompanying notes to consolidated financial statements $ $ Fiscal 2019 110,225 $ 72,653 37,572 $ 19,740 1,989 21,729 15,843 1,128 14,715 3,473 $ 11,242 $ (73) 1,201 1,093 10.29 $ 1,097 10.25 $ Fiscal 2019 11,242 $ 53 8 3 Fiscal 2018 THE HOME DEPO CONSOLIDATED STATEMENTS OF COMPREHENSIVE INCOME 64 11,306 $ 108,203 $ 71,043 37,160 19,513 1,870 247 21,630 15,530 1,061 16 974 (93) 14,566 3,435 11,121 $ 1,137 9.78 $ 1,143 9.73 $ Fiscal 2018 11,121 $ 53 (206) 10,915 $ Fiscal 2017 100,904 66,548 34,356 17,864 1,811 19,676 14,681 (74) 1,057 983 13,698 5,068 8,630 1,178 7.33 1,184 7.29 Fiscal 2017 8,630 311 (9) 301 8,931 Table of Contents in millions, except per har det Net sales Cost of sales Gross profit Operating expenses: Selling, general and administrative Depreciation and amortization Impairment loss Total operating expenses THE HOME DEPOT, INC. CONSOLIDATED STATEMENTS OF EARNINGS Operating income Interest and other (income) expense: Interest and investment income Interest expense Other Interest and other, net Earnings before provision for income taxes Provision for income taxes Net earnings Basic weighted average common shares Basic earnings per share Diluted weighted average common shares Diluted earnings per share Fiscal 2020 and facal 2019 include 52 weeks. Facal 2018 includes 53 weeks. Se accompanying notes to consolidated financial statements Table of Contents Cash flow hedges Other in milliona Net earnings Other comprehensive income (loss), net of tax: Foreign currency translation adjustments 40 Total other comprehensive income (loss) Comprehensive income $ Fiscal 2020 and facal 2019 include 52 weeks. Fiscal 2018 includes 53 weeks. Se accompanying notes to consolidated fielment $ $ Fiscal 2020 $ 132,110 $ 87,257 44,853 24,447 2,128 26,575 18,278 (47) 1,347 1,300 16,978 4,112 12,866 1,074 11.98 $ 1,078 11.94 $ Fiacal 12,866 $ 60 THE HOME DEPOT, INC. CONSOLIDATED STATEMENTS OF COMPREHENSIVE INCOME 8 Fiscal 2019 68 12,934 110,225 $ 72,653 37,572 19,740 1,989 21,729 15,843 (73) 1,201 1,128 14,715 3,473 11,242 1,093 10.29 $ 1,097 10.25 $ 11,242 $ 53 8 3 64 11,306 Fiscal 2018 108,203 71,043 37,160 19,513 1,870 247 21,630 15,530 (93) 1,051 16 974 14,556 3,435 11,121 1,137 9.78 1,143 9.73 11,121 (267) 53 8 (206) 10,915 in millions, except per share data Net sales Cost of sales THE HOME DEPOT, INC. CONSOLIDATED STATEMENTS OF EARNINGS Gross profit Operating expenses Selling, general and administrative Depreciation and amortization Total operating expenses Operating income Interest and other (income) expense: Interest and investment income Interest expense Interest and other, net Earnings before provision for income taxes Provision for income taxes Net earnings Basic weighted average common shares Basic earnings per share Diluted weighted average common shares Diluted earnings per share See accompanying notes to consoldated filmen Table of Contents in milions Net earnings Other comprehensive (loss) income, net of tax: Foreign currency translation adjustments Cash flow hedges Other 38 Total other comprehensive (loss) income, net of tax Comprehensive income See accompanying notes to consoldated inancial statement $ S Fiscal 2021 151,157 $ 100,325 50,832 25,406 2,386 27,792 23,040 1,347 1,303 21,737 5,304 16,433 $ 1,064 15.59 $ 1,068 15.53 $ Fiscal 2021 $ 16,433 $ 9 Fiscal 2020 35 (33) 16,400 $ 132,110 $ 87,257 44,853 THE HOME DEPOT, INC. CONSOLIDATED STATEMENTS OF COMPREHENSIVE INCOME 24,447 2,128 26,575 18,278 1,347 1,300 16,978 (47) 4,112 12,906 $ 1,074 11.98 $ 1,078 11.94 $ Fal 2020 12,966 S 60 68 12,934 $ Fiscal 110,225 72,653 37,572 19,740 1,989 21,729 15,843 (73) 1,201 1,128 14,715 3,473 11,242 1,093 10.29 1,097 10.25 Fiscal 2012 11,242 53 8 3 64 11,306
Step by Step Solution
There are 3 Steps involved in it

Get step-by-step solutions from verified subject matter experts