

Question: use chart show work on the side if needed Presented below is the 2018 income statement and comparative balance sheet information for Tiger Enterprises. TIGER
 use chart show work on the side if needed
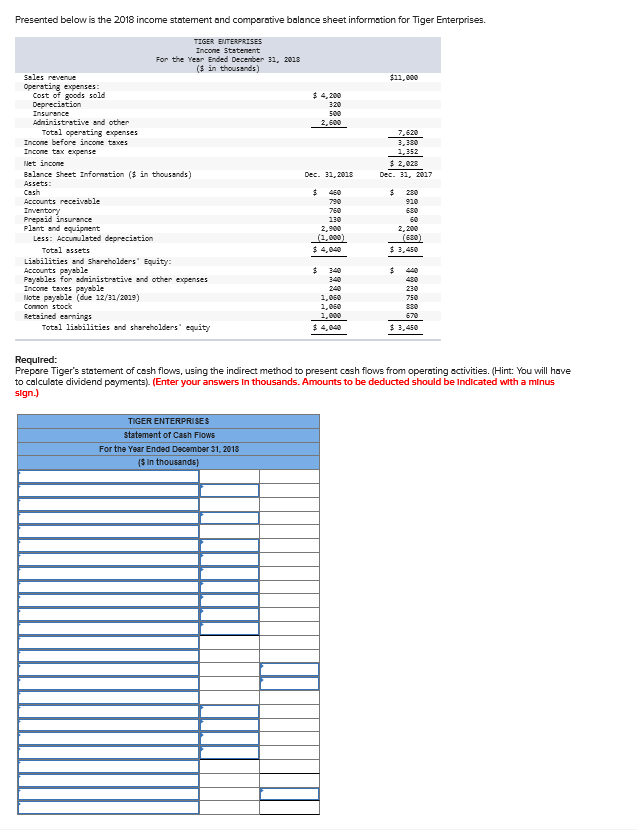
Presented below is the 2018 income statement and comparative balance sheet information for Tiger Enterprises. TIGER ENTERPRISES Income Statement sales revenue Operating expenses: Cost of goods sold Depreciation Insurance For the Year Ended December 31, 2018 ($ in thousands) Administrative and other Total operating expenses Income before income taxes Income tax expense Net income Balance Sheet Information ($ in thousands) Assets: Cash Accounts receivable Inventory Prepaid insurance Plant and equipment Less: Accumulated depreciation Total assets Liabilities and Shareholders' Equity: Accounts payable Payables for administrative and other expenses Income taxes payable Note payable (due 12/31/2019) Common stock Retained earnings Total liabilities and shareholders' equity TIGER ENTERPRISES Statement of Cash Flows $ 4,200 320 500 2,600 For the Year Ended December 31, 2018 ($ In thousands) Dec. 31,2018 790 760 130 2,900 (1,000) $4,040 $ 340 340 240 1,060 1,060 1,000 $11,000 7,620 3,300 1,352 $ 2,028 Dec. 31, 2017 910 650 60 $ 2,200 (680) $ 3,450 Required: Prepare Tiger's statement of cash flows, using the indirect method to present cash flows from operating activities. (Hint: You will have to calculate dividend payments). (Enter your answers in thousands. Amounts to be deducted should be indicated with a minus sign.) 230 750 500 670
Step by Step Solution
There are 3 Steps involved in it

Get step-by-step solutions from verified subject matter experts