

Question: Use Credit Risk data file (From James R. Evans) Last edited: Jan 24, 2020 Use Excel for the following questions when needed: 1.For each variable
Use Credit Risk data file (From James R. Evans)
Last edited: Jan 24, 2020
Use Excel for the following questions when needed:
1.For each variable (field) in the data set identify:
a.Variable type (Quantitative or Qualitative and If quantitative, discrete or continuous).(Present in a table format.)
b.Scale used to measure each variable (present it in a table format)
2.Construct Distribution:
a.For each variable, construct Empirical distribution: Frequency Distribution and Relative Frequency Distribution (and if warranted, construct Cumulative Relative Distribution.)
b.Apply ameaningful chart typeto present each of the Relative Frequency Distribution (and Cum. Rel. Freq.) calculated in part "a". (Freq. Dist. Plot is not necessary).
3.Apply Box plot for the field/variable, "Months Employed".Briefly interpret what the plot shows.
4.Construct a histogram of the z-scores of the "Savings" field. Briefly explain information provided by the chart.
Note 1:Some charts (such as histogram) can be constructed directly using the wizard.Other charts may need some Excel calculations before making it ready for plotting.All charts MUST have appropriate labels and chart title. Minimize the use of color or shading unless it is necessary.
Note 2:Your work must be organized and easy to follow.
Note 3:All your work should be stored inone Excel filewithmultiple sheets.Each sheet should contain the answers to only one of the above question sets. Therefore, your Excel file will have five sheets.Use the following labels:
First sheet:Base Data
Second:Variable Type
Third:Distribution
Fourth:Box Plot
Fifth:z-score
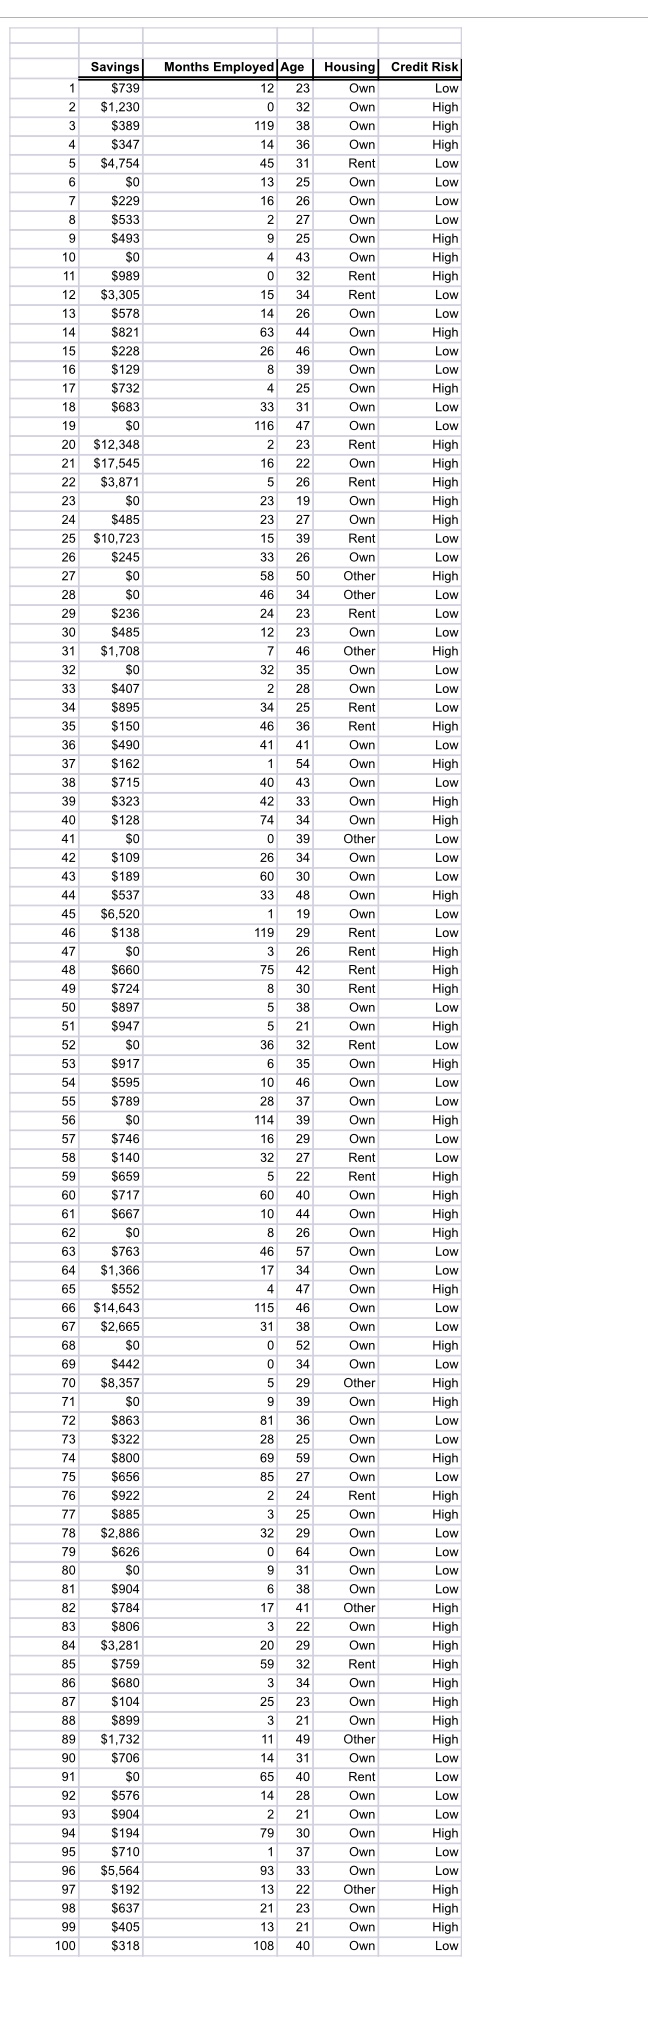
$73 $1,230 32 Own $389 $347 36 High 31 Rent 13 25 Own Low $229 16 26 $533 2 27 $493 High 10 4 43 Own 32 Rent High $578 26 $821 High 15 $228 26 46 Own Low $129 $732 25 5683 33 31 116 47 Own 20 $12,348 23 Rent High $3,871 26 Rent High 23 19 24 $485 23 27 Own High 25 39 26 $245 26 27 50 High 28 34 Other 29 $236 24 23 Rent 30 $485 31 $1,708 46 Other High 35 33 $407 28 Own Low 34 25 $150 36 36 $490 $162 54 Own 38 $715 43 Own 39 $323 33 40 $128 74 34 High 41 39 42 $109 26 34 Own Low 43 44 $537 33 48 45 $6,520 19 46 $138 29 Rent 26 Rent 42 Rent 49 $724 8 30 Rent High 50 $897 38 51 $947 5 21 Own High 52 32 53 $917 35 Own 46 55 $789 37 Own 56 114 39 High $746 29 58 $140 32 Rent $659 Rent 60 60 40 Own High 44 26 Own High 63 $763 57 34 Own 65 47 High 115 46 $2,665 31 38 52 69 $442 34 Own 29 71 9 39 High 81 73 $322 28 25 Own 74 69 59 High 75 $656 27 76 $922 2 24 Rent High $885 25 78 $2,88 32 29 Own 80 38 82 $784 41 83 22 20 29 85 $759 59 32 Rent High $680 34 87 $104 25 23 Own High 21 89 $1,732 49 Other High 90 31 91 65 40 Rent Low 92 $576 28 $904 21 94 $194 79 30 High 95 $710 37 Own 96 93 33 Own 98 $637 21 23 Own High $405 21 High 100 108 40 Own Low
Step by Step Solution
There are 3 Steps involved in it

Get step-by-step solutions from verified subject matter experts