

Question: Use Data Table to graph the present value as a function of the discount rate. I keep getting 0 when doing the Data Table. Please
Use Data Table to graph the present value as a function of the discount rate.
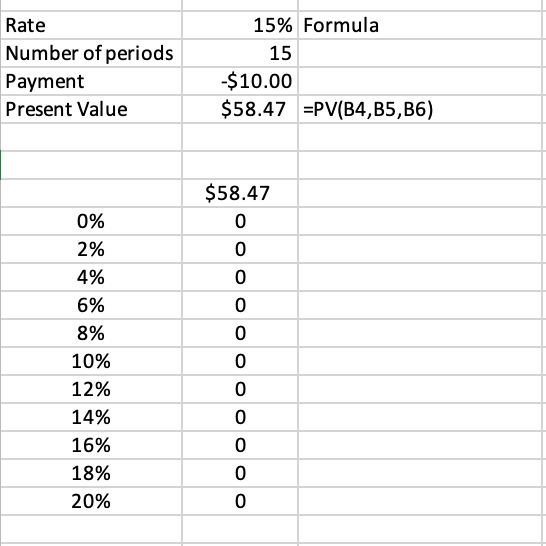
I keep getting 0 when doing the Data Table. Please help!
\begin{tabular}{|l|r|l|} \hline Rate & 15% & Formula \\ \hline Number of periods & 15 & \\ \hline Payment & $10.00 & \\ \hline Present Value & $58.47 & =PV(B4,B5,B6) \\ \hline \end{tabular} \begin{tabular}{|c|c|} \hline & $58.47 \\ \hline 0% & 0 \\ \hline 2% & 0 \\ \hline 4% & 0 \\ \hline 6% & 0 \\ \hline 8% & 0 \\ \hline 10% & 0 \\ \hline 12% & 0 \\ \hline 14% & 0 \\ \hline 16% & 0 \\ \hline 18% & 0 \\ \hline 20% & 0 \\ \hline \end{tabular}
Step by Step Solution
There are 3 Steps involved in it
1 Expert Approved Answer
Step: 1 Unlock

Question Has Been Solved by an Expert!
Get step-by-step solutions from verified subject matter experts
Step: 2 Unlock
Step: 3 Unlock